
Last updated: June 11, 2026
Post-Shot xG measures how difficult a shot was to save after it’s been struck – based on its placement, speed, and trajectory.
For a primer on standard xG, see our Expected Goals explained guide. It’s one of the most reliable ways to evaluate true goalkeeping performance.
What is Post-Shot xG and why does it change how we judge goalkeepers?
We need to have a serious conversation about how goalkeepers are judged.
For decades, we’ve relied on the “eye test” or, even worse, the “clean sheet” tally to decide who belongs in the elite tier. You see a keeper flying into the top corner for a camera save, and you think, “world class.” You see a keeper concede two goals in a game where his defense collapsed, and you think, “he’s struggling.”
But here is the reality: clean sheets are a team stat, not a goalkeeper stat. Judging a keeper by clean sheets is like judging a striker solely by how many corners his team wins – it’s a byproduct of the system, not the individual.
To truly isolate goalkeeper performance, we have to strip away the defense. We have to look strictly at what happens from the moment the ball leaves the striker’s boot to the moment it reaches the goal line.
In simple terms: It tells you how hard a shot was to save – not just how dangerous the chance looked.
This is where Post-Shot xG comes in. It is one of the most reliable metrics in modern football analysis. It separates “busy” keepers from truly elite shot-stoppers and highlights those who consistently outperform expectation.
In this breakdown, we’ll show exactly why Post-Shot xG reveals which goalkeepers are actually saving goals – and which ones are being protected by their defense.
The 5 Reasons Post-Shot xG Matters
- xG Doesn’t Measure the Goalkeeper
xG evaluates the chance – not the shot. It tells you how dangerous the situation was, not how difficult the save was. - PSxG Measures Shot Difficulty
By accounting for placement, speed, and trajectory, PSxG captures how hard the shot actually was to save. - It Reveals “Goals Prevented”
PSxG allows us to compare expected goals conceded vs actual – exposing which keepers outperform or underperform. - It Removes Defensive Bias
Clean sheets and goals conceded depend heavily on the defense. It isolates the goalkeeper’s contribution. - It’s the Best Evaluation Tool
For scouting, contracts, and analysis, PSxG provides a more reliable measure than traditional stats.
Key Takeaways
- xG vs. PSxG: Standard xG measures the quality of the chance before the shot is taken; PSxG measures the quality of the shot itself (trajectory, speed, placement). +4
- The “Alisson Effect”: Elite keepers consistently concede fewer goals than their PSxG predicts (positive “Goals Prevented”).
- Context Matters: Facing high PSxG doesn’t mean poor goalkeeping-it often means poor defense.
- The Blind Spot: PSxG does not account for goalkeeper positioning errors or sweeping actions-it is purely a shot-stopping metric.
- Evaluator’s Tool: Use PSxG to determine contract value; high PSxG performance is often more sustainable than high assist numbers for playmakers.
Table of Contents
What is Post-Shot xG?
Let’s strip the concept down to the studs. You likely already understand Expected Goals (xG). As we’ve discussed in previous breakdowns, xG assigns a probability to a scoring chance based on historical data. If a striker shoots from the penalty spot, that might be 0.76 xG.

However, xG has a massive flaw when evaluating goalkeepers: it doesn’t care where the ball actually goes.
If that striker takes that 0.76 xG penalty and scuffs it five yards wide, the standard xG model still logs it as 0.76. If you were judging the goalkeeper based on that, you’d be working with bad data because the keeper didn’t have to do anything. The “chance” was dangerous, but the “shot” was garbage.
Post-Shot xG changes the variable. It calculates the probability of a goal after the ball has been struck. It takes into account:
- Trajectory: Is it heading for the top bin or right at the keeper’s chest?
- Speed: Is it a 90mph thunderbolt or a scuffed roller?
- Origin: Where was it shot from?
Think of it this way:
- Scenario A: A striker shoots from 6 yards out (High xG). He mishits it, and it rolls gently into the keeper’s arms.
- Result: High xG, Low PSxG. The keeper gets almost no credit for the save because the shot was poor.
- Scenario B: A striker shoots from 30 yards out (Low xG). He hits a knuckleball that swerves toward the top corner.
- Result: Low xG, High PSxG. If the keeper saves this, he gets massive credit because the shot was almost impossible to stop.
This distinction is vital. xG evaluates the striker’s creativity; PSxG evaluates the striker’s execution and the goalkeeper’s difficulty. When we look at the data, we are essentially asking: Based on the speed and placement of this shot, how often does it result in a goal against the average goalkeeper?
If a keeper faces a PSxG of 0.30, it means 30% of keepers would concede that specific shot. If he saves it, he has “prevented” 0.30 goals. If he concedes, he has performed exactly as expected. This accumulation of data over a season gives us the “Goals Prevented” metric-the gold standard for contract negotiations in the Premier League.
What is PSxG vs xG?
Post-Shot xG vs Expected Goals (xG)
xG measures the quality of a chance before the shot is taken.
Post Shot xG measures the quality of the shot after it is struck.
This difference is crucial:
- xG evaluates the striker’s opportunity
- PSxG evaluates the goalkeeper’s challenge
A weak shot from a good chance = high xG, low PSxG
A perfect strike from distance = low xG, high PSxG
Goalkeeper Analysis: The “Goals Prevented” Metric
Now that we understand the theory, let’s apply it to reality. The true power of Post Shot xG isn’t looking at a single save; it’s looking at the aggregate “Goals Prevented” over a full season. This is how we distinguish between a keeper who is just “lucky” and one who is fundamentally elite.
The formula is simple:
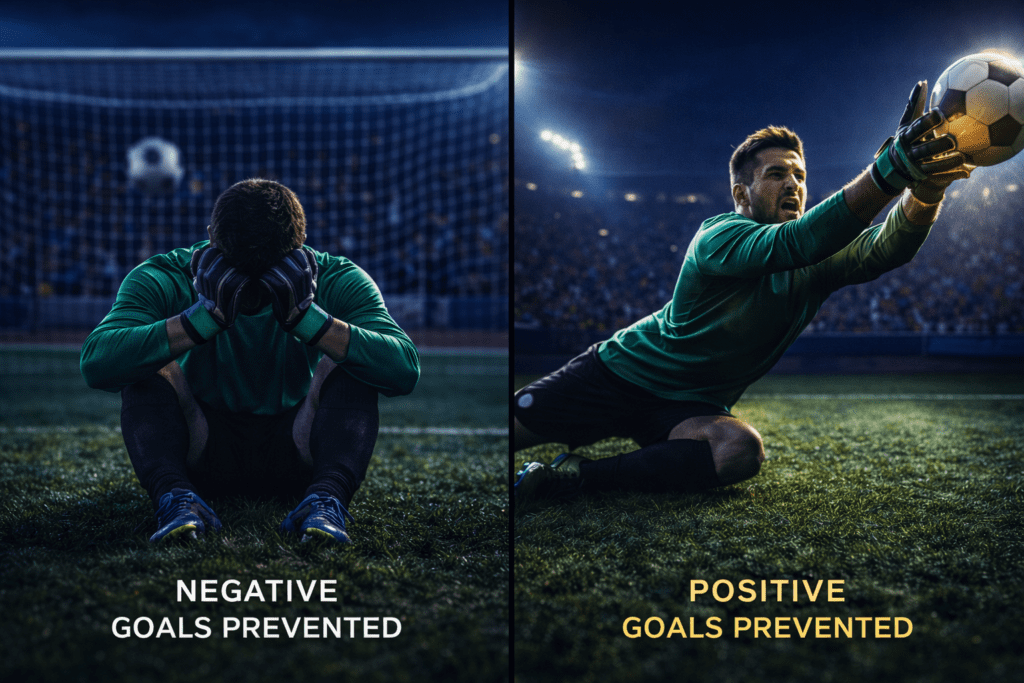
Post-Shot xG Faced minus Goals Conceded = Goals Prevented.
- Positive Number (+): The keeper is saving shots that the average keeper would let in. They are “overperforming.”
- Negative Number (-): The keeper is letting in shots that the average keeper would save. They are a liability.
- Zero (0): They are an average shot-stopper.
Let’s look at a hypothetical comparison between two Premier League profiles to see this in action. We’ll compare Keeper A (The Media Darling) and Keeper B (The Underdog).
| Metric | Keeper A (Media Darling) | Keeper B (The Underdog) | Analysis |
| Minutes Played | 3,420 | 3,420 | Full Season |
| Shots Faced (SoT) | 110 | 185 | Keeper B is much busier. |
| Clean Sheets | 15 | 8 | Keeper A looks “better” on paper. |
| Goals Conceded | 35 | 50 | Keeper A conceded fewer goals. |
| Post-Shot xG Faced | 32.5 | 61.2 | The Turning Point. |
| Goals Prevented | -2.5 | +11.2 | The Reality. |
The Analysis:
Look closely at the table.
Keeper A kept 15 clean sheets and only conceded 35 goals. The pundits are likely praising him for a “solid season.” But the PSxG tells a different story. He faced a PSxG of only 32.5. Based on the quality of shots he faced, he should have conceded roughly 32 or 33 goals. By conceding 35, he actually performed below average. He cost his team 2.5 goals. His defense protected him, making his job easy, and when difficult shots did come in, he failed to save them.
Keeper B, on the other hand, looks like a disaster on the surface. He conceded 50 goals! But look at his PSxG Faced: 61.2. His defense was porous, allowing high-quality shots rain down on him constantly. An average keeper would have conceded 61 goals in his shoes. By limiting it to 50, he prevented 11.2 goals.
Think of David de Gea in the 2017/18 season for Manchester United (per publicly available FBref-equivalent tracking data from that period). He posted a Goals Prevented figure of +13.7. That is statistically absurd. He single-handedly dragged that United team to second place. Without PSxG, we just say “His Post Shot xG numbers reflect elite shot-stopping efficiency.” With PSxG, we can mathematically prove he was worth an extra 13 points in the league table.
This metric helps us avoid the “Clean Sheet Trap.” A keeper at Manchester City might have a PSxG Faced of 0.1 for the whole game. He does nothing. A keeper at Luton Town might face a PSxG of 3.5. Comparing them on goals conceded is useless. Comparing them on their delta (Goals Prevented) levels the playing field.
The Weakness / How to Counter

I would love to tell you that PSxG is the perfect stat, but as we always say at KharaSports Daily: context kills the spreadsheet. If you rely solely on this metric, you will sign a goalkeeper who is a great shot-stopper but a terrible footballer.
Here is the nuance the data misses:
1. It ignores Positioning Errors
PSxG measures the shot’s location relative to the goal frame, not the goalkeeper’s location.
Imagine a keeper gets caught out of position-say, he comes for a cross, misses it, and leaves the net empty. The striker heads the ball into the center of the empty net.
- The shot is slow.
- The placement is central.
- Result: Low PSxG.Because the model thinks “a slow header to the center of the goal is usually saved,” the model expects a save. When the goal goes in, the keeper gets hammered with a huge negative score on his “Goals Prevented.”However, sometimes a keeper’s bad positioning makes a shot look harder than it is. If a keeper stands too far to his left, and the striker shoots to the right, the keeper has to make a diving, fingertip save. The model sees a “corner shot” (High PSxG) and praises the keeper for saving it. But a better-positioned keeper would have caught it easily. In this specific instance, PSxG can sometimes reward inefficient positioning.
2. It ignores “Sweeping” and Cross Claiming
This is the modern game’s biggest divider. PSxG only triggers if a shot is taken.
Think of Alisson Becker or Manuel Neuer. Their greatest strength is often rushing out of the box to clear a through-ball before the striker can shoot.
In the 2024-25 season, Alisson continued to post positive goals prevented figures for Liverpool despite increased shot volume – consistently outperforming the average keeper benchmark across all shot locations.
- If Alisson clears the ball 30 yards from goal: PSxG = 0.
- If a timid keeper stays on his line, allows the striker to shoot, and then makes a miracle save: PSxG = High.
In this scenario, the timid keeper generates better “Shot Stopping” PSxG data, even though Alisson prevented the danger from even occurring. This is why you cannot look at PSxG in isolation. It must be paired with metrics like Defensive Actions Outside the Penalty Area (OPA) or Crosses Stopped % to get the full picture of the “Ultra-Human” goalkeeper.
3. The Sample Size Trap
Goalkeeping data is incredibly “noisy.” A keeper can have a “hot hand” for 10 games (variance) where they save everything. Remember when Dean Henderson had that incredible run for Sheffield United? His PSxG numbers were off the charts. But over a 3-year period, data tends to regress to the mean. You should never judge a keeper’s PSxG on less than 1,500 minutes of play.
Pulling It All Together
Post-Shot xG is the great equalizer. It strips away the noise of the defense, the bias of the media narrative, and the deception of the clean sheet. It tells us, with brutal honesty, how good a goalkeeper is at the one job they were originally hired to do: keep the ball out of the net.
However, as we move into an era of “Ball-Playing Keepers” and “Sweeper Keepers,” PSxG is becoming just one piece of the puzzle. It tells you if they can save; it doesn’t tell you if they can play.
When analyzing your team’s keeper this weekend, don’t just look at the scoreboard. Look at the quality of the chances they faced. Did they make the saves they were supposed to make? Did they steal a goal back for their team? Or are they just a spectator with a good view of a solid defense?
In the ruthless world of elite football, “average” is the enemy. PSxG is the only way to spot it before it costs you a title.
What do you think?
Was De Gea’s 2017-18 season the strongest PSxG performance in Premier League history – or is there a keeper who did something more remarkable that the stats actually show?
Related Tactical Breakdowns
PSxG only tells you how hard the save was – these breakdowns cover the chance quality, defensive pressure, and goalkeeper positioning that determine what shots actually arrive in the first place.
What Is xG? Expected Goals Explained
PPDA in Football: Pressing Intensity
Sweeper-Keeper: Role, Tactics & Examples
This is how modern goalkeeping is actually evaluated – not by saves, but by the system around them.
Don’t just watch football. Understand it.
Join KharaSportsDaily for occasional deep tactical insights most fans miss.
Frequently Asked Questions (FAQs)
Does Post-Shot xG account for the position of the defenders?
Generally, no. Standard PSxG models look at the shot trajectory and origin. However, some advanced models (like StatsBomb’s) do factor in the “freeze frame” of defender positioning to calculate the pressure on the shooter, but purely for the Post-Shot value, it is mostly about where the ball is going relative to the goal mouth.
Can a goalkeeper have a generic xG higher than their Post-Shot xG?
Yes. This implies the team’s opponents are bad at finishing. If a team concedes a lot of high-xG chances (tap-ins) but the strikers keep missing the target or scuffing shots, the PSxG will be lower than the pre-shot xG. This usually suggests the defense is bad, but the opponents are wasteful.
What is a “World Class” PSxG +/- number for a season?
Anything over +5.0 to +7.0 goals prevented in a single league season is considered elite. If a goalkeeper hits double digits (like +10.0), they are essentially having a “Player of the Season” caliber performance. Conversely, anything below -5.0 suggests the keeper is a significant problem.