

Last updated: April 29, 2026
Liverpool’s press in the 2019-20 title season averaged a PPDA of 7.58 per Opta – meaning they forced a defensive action for every 7.58 passes the opponent completed. Tottenham, mid-table that same season, averaged 13.2. That gap of 5.6 passes is not a minor statistical difference. It is the distance between suffocating and passive.
For years, pressing was described emotionally – “they wanted it more,” “they pressed harder.” Modern football demands measurement.
In simple terms: PPDA – Passes Allowed Per Defensive Action – counts how many passes a team concedes before making a tackle, interception, or foul. The lower the number, the more intensely they press.
This breakdown covers how PPDA in Football is calculated, what elite benchmarks look like, and where the metric misleads analysts who rely on it alone.
Key Takeaways
- Lower means more aggressive: A PPDA under 9.0 signals an elite high press – Liverpool and Bayer Leverkusen operate here. Above 13.0 signals a passive low-block structure.
- Context distorts the number: Facing a possession-dominant side like Manchester City inflates your PPDA regardless of intent. Always check the opponent before judging the score.
- Intensity is not the same as quality: A team can press hard and still concede chances if their shape breaks. PPDA measures activity, not defensive success.
- PPDA only counts the attacking 60%: Defensive actions inside the opponent’s own box are excluded. The metric is designed to measure proactive pressing, not desperation.
- Pair it with xG Against: A low PPDA with a high xG Against means the press is being bypassed. The two metrics together reveal whether the press is working, not just happening.
Table of Contents
What Is PPDA in Football?
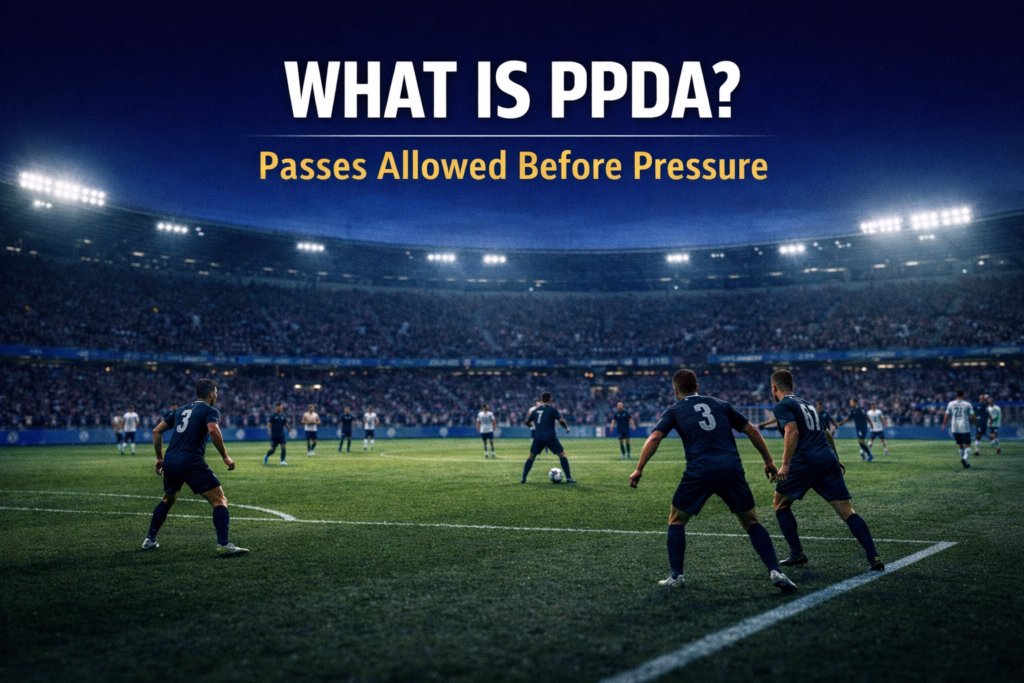
PPDA – Passes Allowed Per Defensive Action – measures how many passes a team allows before attempting a tackle, interception, or foul in the opponent’s half. Colin Trainor introduced PPDA via his football analytics blog in 2013, before StatsBomb was founded as a company in 2017 and later popularised the metric through their open data releases.
Unlike simple tackle counts or interception numbers – which can be misleading because a team that has 20% possession will naturally tackle more – PPDA football stats provide context. They measure how many passes a team allows their opponent to make before trying to break up the play with a defensive action (tackle, interception, challenge, or foul).
Think of it as an “aggression index.”
- Lower PPDA number: You press hard. You don’t let the opponent breathe.
- Higher PPDA number: You sit back. You are passive. You prioritize shape over disruption.
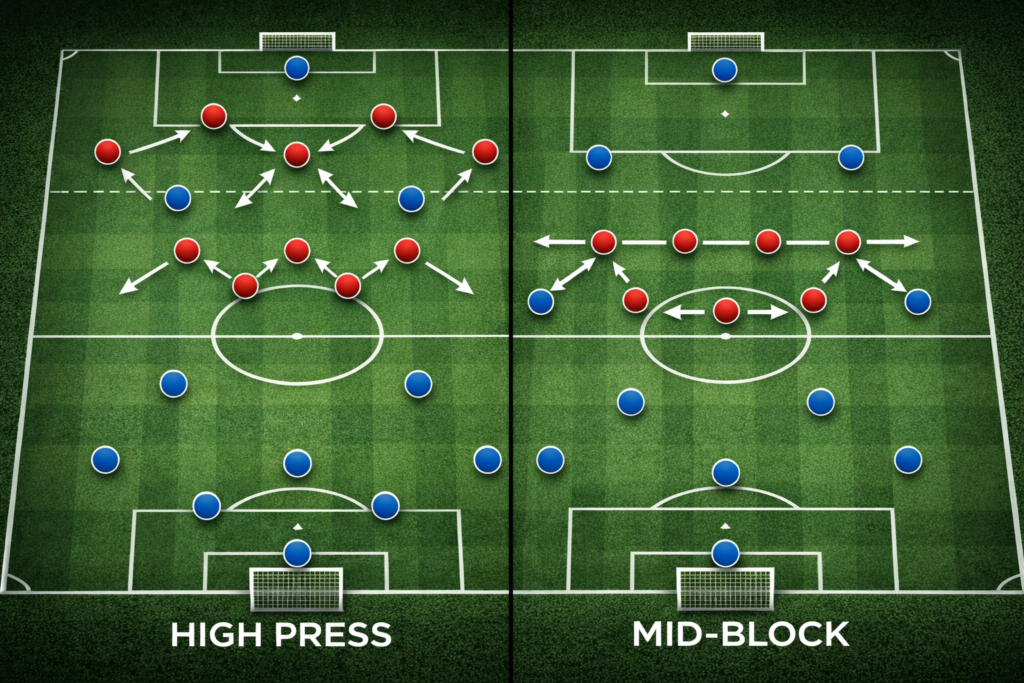
Where the High Press vs Mid-Block breakdown covers defensive intent, PPDA is the measurement of that intent.
PPDA vs Other Pressing Metrics: StatsBomb’s Definition Explained
While StatsBomb popularized PPDA in the early 2010s, it’s often confused with other pressing metrics like PPDA against (PPDAa), field tilt, or pressing success rate. Here’s how PPDA differs:
- PPDA measures *your* pressing intensity (how few passes you allow)
- High press success rate measures what happens *after* you press
- Field tilt measures territorial dominance, not defensive actions
Understanding these distinctions helps you read match reports from Opta, StatsBomb, and FBref without conflating metrics.
How to Calculate PPDA: The Formula Explained

To truly master PPDA football stats, you have to look under the hood. Don’t worry, I won’t make you do algebra, but understanding the formula helps you spot the outliers.
The formula is generally:
PPDA = Opponent Passes ÷ Defensive Actions.
However, there is a catch. We don’t count passes made by the opponent inside their own six-yard box, and we usually only count defensive actions that occur within a specific zone (typically the attacking 60% of the pitch).
Why restrict the zone?
Because every team defends when the ball is in their own penalty box. That’s desperation, not a tactical “press.” PPDA football stats are designed to measure proactive defending – defending done high up the pitch to regain possession, not just last-ditch blocks.
What counts as a Defensive Action?
- Tackles: Successful or unsuccessful attempts to dispossess.
- Interceptions: Cutting out a pass.
- Challenges: Failed tackles where the ball isn’t won but the player is engaged.
- Fouls: Yes, tactical fouls are a method of breaking up play!
By dividing the opponent’s pass volume by these actions, PPDA football stats give us a ratio that standardizes defensive work rate regardless of how much possession a team has.
Interpreting the Numbers: High vs. Low Intensity
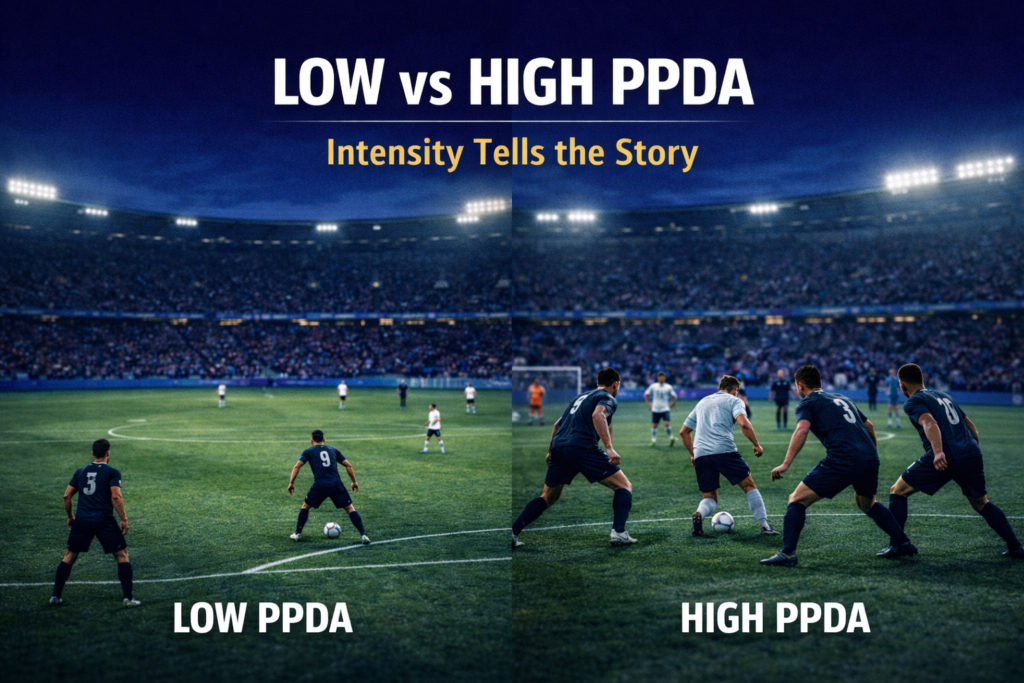
This is where many people get tripped up. In PPDA football stats, a LOWER number means HIGHER intensity. It’s like a golf score – you want it low if you want to be considered a high-pressing team.
Let’s break it down with a simple comparison table to visualize what these numbers actually look like in a top 5 European league context.
Table 1: Interpreting PPDA Ranges
| PPDA Range | Intensity Level | Tactical Style | Example Teams (Historical) |
| 6.0 – 9.0 | Ultra-High Intensity | Gegenpressing, Man-to-Man High Press | Leeds (Bielsa), Liverpool (2019) |
| 9.1 – 12.0 | High to Moderate | Mid-Block Pressing, Selective Press | Man City, Arsenal, Bayern Munich |
| 12.1 – 16.0 | Passive/Patient | Low Block, Containment | Wolves, Crystal Palace |
| 16.0+ | Deep Defensive Shell | “Parking the Bus”, Extreme Low Block | Newcastle (Benitez era), Getafe |
If you see a team with PPDA football stats sitting around 7.5, you know immediately – without even watching the game – that they are swarming the ball carrier. If you see a 18.2, you know they are sitting deep, likely playing for a counter-attack.
This connects directly to our previous guide on Low Block Defense Explained. A team playing a low block will almost always have a high PPDA because they invite passes per defensive action in non-dangerous areas. The PPDA pressing metric operates on an inverted scale – lower means more intense.
| Team | 2025-26 PPDA | Pressing Style |
|---|---|---|
| Liverpool | 9.89 | Aggressive high press |
| Arsenal | ~10.5 | Triggered high press |
| Manchester City | ~12.0 | Positional / mid-block |
| Atlético Madrid | ~14.0+ | Defensive low block |
*Liverpool figure confirmed 2025-26. Other figures are approximate based on tactical profiles.
How to Calculate PPDA in Football
Step 1 – Identify opponent passes
Count all passes the opposing team completes in your defensive territory. Exclude passes inside their own six-yard box.
Step 2 – Count your defensive actions
Count all tackles, interceptions, and fouls your team makes in the attacking 60% of the pitch only.
Step 3 – Apply the formula
Divide opponent passes by your defensive actions: PPDA = Opponent Passes ÷ Defensive Actions
Step 4 – Interpret the result
Under 9.0 = aggressive high press. 9–13 = moderate pressing. Above 13.0 = passive low block.
The Tactical Spectrum: From Klopp to Simeone

To understand the soul of PPDA football stats, we have to look at the managers who define the spectrum.
The Kings of Low PPDA: Jurgen Klopp & Marcelo Bielsa
When Jurgen Klopp arrived in England, he famously said, “No playmaker in the world can be as good as a good counter-pressing situation.” His Liverpool teams in their prime consistently posted PPDA football stats in the 7.0 to 9.0 range. They didn’t wait for mistakes; they forced them.
Marcelo Bielsa at Leeds United took this to an extreme. His man-marking system required constant engagement. Their PPDA was often the lowest in the league, reflecting a style that was physically exhausting but tactically suffocating.
The Masters of High PPDA: Diego Simeone & Jose Mourinho
On the flip side, a high PPDA isn’t “bad.” It’s a stylistic choice. Diego Simeone’s Atletico Madrid often records higher PPDA football stats because they are comfortable letting the opponent have the ball in harmless areas (like the center backs passing laterally).
Simeone’s philosophy is about controlling space, not just the ball. If you only look at PPDA football stats and assume Atletico is “lazy,” you are misreading the game. They are efficient. They wait for the ball to enter a specific “trap zone” before triggering a press. This is crucial when analyzing How Elite Teams Defend Without the Ball.
Real-World Case Study: The Premier League Shift
Let’s look at a real-world evolution using PPDA football stats.
In the 2017/18 season, Manchester City under Pep Guardiola recorded a PPDA of around 8.3. They were frantic, trying to win the ball back immediately (the “6-second rule”).
Fast forward to the 2023/24 season. City’s PPDA actually rose slightly in certain phases of the season. Why? Because they evolved into a team that valued control and resting on the ball over chaotic pressing. They utilized what we call a “paused press” – blocking passing lanes rather than sprinting at the keeper.
This nuance is why looking at PPDA football stats in isolation can be tricky. A team might press less often (higher PPDA) but press more effectively when they do choose to engage. This ties into the Box Midfield (3-2-2-3) structures, which allow teams to retain possession so well they don’t need to press as often – they already have the ball!
Common Pitfalls: Where PPDA Lies
I have to be honest with you – PPDA football stats are not perfect. In my years analyzing data, I’ve seen gamblers and analysts burn money by following this metric blindly. Here are the traps to avoid:
1. The “Possession Skew”
If a team plays against Manchester City, their PPDA will naturally be high (bad). Why? Because City holds the ball for 70% of the game and completes 800 passes. Even if the opponent is trying their hardest to press, the sheer volume of City’s passes will inflate the opponent’s PPDA football stats.
2. Game State Effects
Imagine a team goes up 3-0 in the first 20 minutes. What do they do? They stop pressing. They sit back to protect the lead. Their final PPDA for the match might look “passive” (e.g., 14.0), even though they destroyed the opponent with a high press in the first 20 minutes. Always check game-state adjusted PPDA if available.
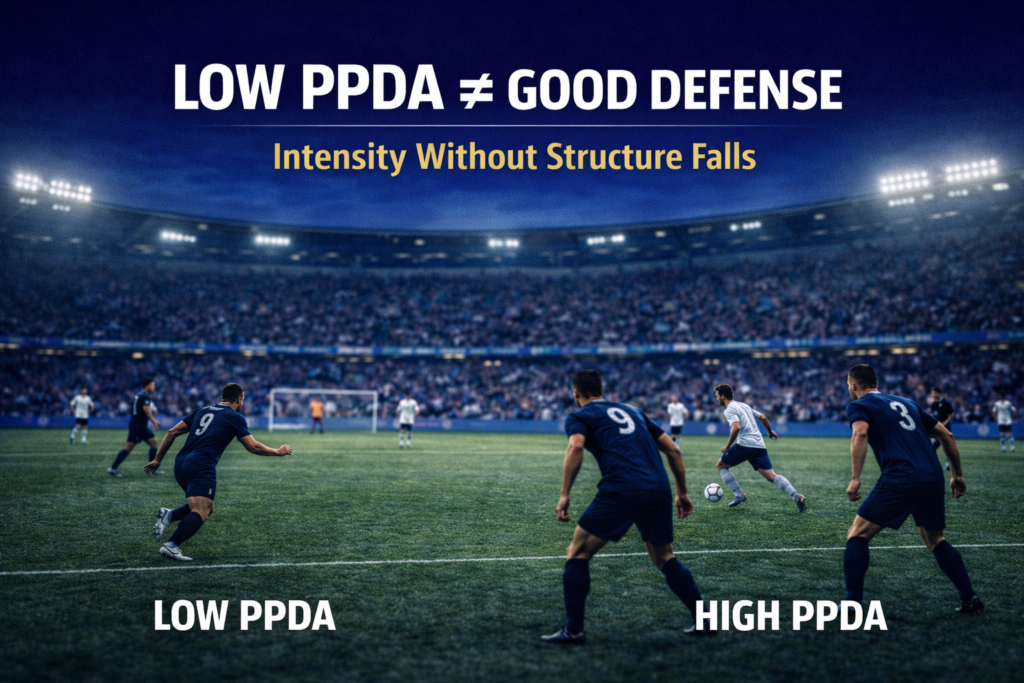
3. False Positives (The “Bad Press”)
A team can have a low PPDA (indicating high intensity) but still be a terrible defensive team. This happens when players run around like headless chickens – pressing individually without a system. They are making “defensive actions,” but they are getting bypassed easily. A low PPDA shows effort, not necessarily success.
Connecting PPDA to Other Key Metrics
To get the full picture, you need to pair PPDA football stats with other metrics from our Metrics & Models series.
- Field Tilt: PPDA tells you how they press; Field Tilt tells you where the game is played. A team with low PPDA and high Field Tilt is a dominant territory team.
- Buildup Disruption Percentage (BDP): This is the cousin of PPDA. While PPDA counts passes allowed, BDP measures the percentage of opponent passing chains that you successfully break. It’s often a better measure of success than pure intensity.
- xG Against: If you have a low PPDA (high press) but a high xG Against (conceding chances), your high line is getting exposed. This is often the trade-off discussed in Inverted Fullbacks Explained, where pushing players up leaves gaps behind.
Final Thoughts
PPDA football stats are a diagnostic tool, not a verdict. Suddenly, you don’t just see players running; you see the tactical intent of the manager. You see the invisible lines drawn on the pitch.
Metrics are tools, not rules. Use PPDA to support what your eyes tell you. When you see a team trapping an opponent in the corner, check the stats. Is it a one-off, or is it their identity?
To see how pressing intensity connects to chance creation, read our breakdown of Expected Threat (xT) – the metric that measures what PPDA alone cannot.
If you want to see how a low PPDA translates to attacking success, read our case study on Xabi Alonso’s Leverkusen Blueprint.
What do you think?
Liverpool’s 2025-26 PPDA sits at 9.89 – aggressive, but not Klopp-era numbers. Is that a sign Arne Slot has deliberately softened the press to protect the back four, or is it the cost of playing fewer high-intensity matches early in the season? Drop your read below.
Related Tactical Breakdowns
Why it connects: PPDA is the data layer beneath the high press vs mid-block decision – the number that quantifies which side of that tactical divide a team sits on.

Why it connects: Counter-pressing is the most PPDA-intensive defensive approach in football – understanding the metric explains why Klopp’s 6-second rule was so measurably different from the league average.

Why it connects: Low blocks produce the highest PPDA numbers in football – seeing both sides of the pressing spectrum makes the metric’s inverted scale immediately legible.
Don’t just watch football. Understand it.
Join KharaSportsDaily for occasional deep tactical insights most fans miss.
Frequently Asked Questions (FAQs)
What is a “good” PPDA number?
There is no “good” or “bad,” only stylistic differences. However, for elite teams chasing titles in modern football (like Arsenal or Leverkusen), a PPDA between 8.0 and 10.0 is standard. It shows dominance without recklessness.
Does PPDA count interceptions?
Yes. PPDA football stats include tackles, interceptions, fouls, and failed challenges. It sums up all defensive attempts to win the ball.
How does PPDA compare to other pressing metrics?
PPDA measures intensity – how often you attempt to press. Metrics like PPDA success rate or Buildup Disruption Percentage (BDP) measure effectiveness – whether those pressing attempts actually win the ball. Use both together for a complete picture of a team’s defensive approach.
Where can I find PPDA stats?
What does PPDA stand for in football?
PPDA stands for Passes Allowed Per Defensive Action. It measures how many passes a team allows opponents to complete before making a tackle, interception, or foul.
How do you calculate PPDA?
PPDA = Opponent Passes ÷ Defensive Actions. Only passes outside the opponent’s six-yard box and defensive actions in the attacking 60% of the pitch are counted.
What is a good PPDA score for a pressing team?
A PPDA score between 7.0 and 9.0 represents elite pressing intensity. Liverpool under Jurgen Klopp regularly operated in this range, per Opta data. Scores between 9.0 and 11.0 reflect a structured mid-block press. Above 13.0 typically indicates a passive low-block system prioritising shape over disruption.