

Last updated: June 11, 2026
For decades, football rewarded the final touch. The goal. The assist. The player who squared the ball for a tap-in got the headlines. The midfielder who split the defensive line three passes earlier got nothing. Expected Threat (xT) changes that. It is the metric that finally gives credit to the architects – the progressors and playmakers who build danger before the final glory.
Expected Threat (xT) is an advanced football metric that measures the probability increase of scoring a goal based on moving the ball from one pitch zone to another. Unlike Expected Goals (xG), which only values shots, xT rewards players who progress the ball into dangerous areas – even if no shot results.
According to traditional stats, that winger did nothing. But your eyes told you he just tore the opposition apart. This creates a massive disconnect between data and reality. We judge players on “end product,” ignoring the “process” that makes the end product possible.
In simple terms: Expected Threat (xT) is a probability model that assigns a value to every pass and carry based on how much it moves the ball toward goal.

This is where expected threat football analysis changes everything. Unlike xG, which cares only about the shot, or xA, which cares only about the final pass, expected threat football analysis measures the value of moving the ball into dangerous areas. It is the xT metric that finally gives credit to the architects, the progressors, and the masterminds who dictate play before the final glory.
If you are serious about understanding how elite teams like Manchester City or Arsenal break down low blocks, you cannot rely on assist charts. You need to understand the hidden value of possession value models.
(For a deeper dive into the foundations of modern analysis, visit our Football Tactics Frameworkto see how this connects to Positionism and Space).
Key Takeaways
- Beyond the Shot: Expected Threat (xT) measures the value of moving the ball to dangerous zones, regardless of whether a shot follows.
- The Grid System: The pitch is divided into zones, each assigned a probability of a goal resulting from possession in that square.
- Credit Where Due: xT rewards players who break lines and progress play (e.g., Odegaard, Kroos) rather than just the final passer.
- The flaw of xA: Expected Assists only register if a shot is taken; xT registers value the moment the ball is moved successfully.
Table of Contents
What Is Expected Threat Football (xT)?
Expected Threat (xT) is a probability model that measures how much any pass or carry increases a team’s likelihood of scoring – regardless of whether a shot follows. It answers a simple but profound question: How much more likely are we to score now that the ball has moved from Point A to Point B?
Expected Goals (xG) measures the quality of a shot. xG measures the quality of a shot. But shots are rare events. In a 90-minute match, a team might have possession for 50 minutes but only take 15 shots. What happens during the other 49 minutes of possession? Is that time useless?
Of course not.
Every pass, dribble, or carry alters the state of the game. When a center-back passes sideways to another center-back in their own box, the likelihood of scoring in the next 10 seconds is almost zero. However, if that center-back fires a laser pass through the midfield lines to a Number 10 standing in Zone 14, the likelihood of scoring skyrockets.
Expected Threat captures that difference. It assigns a “threat value” to every start point and end point of an action.
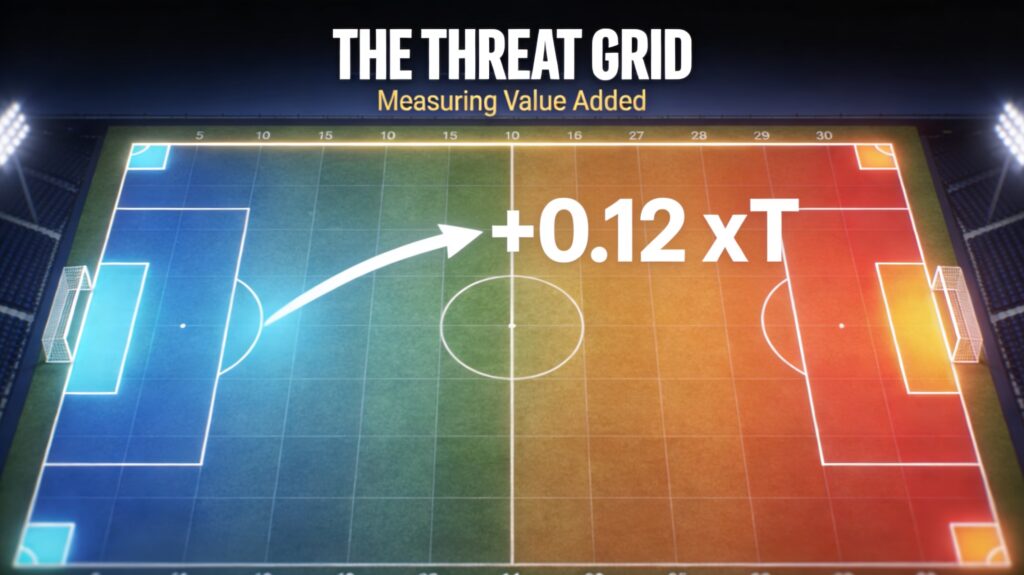
The Math Simplified:
xT = (Probability of Goal from End Zone) – (Probability of Goal from Start Zone)
If you move the ball from a zone with a 1% scoring probability to a zone with a 15% scoring probability, you have generated +0.14 xT. You have added value to your team’s attack, even if you pass the ball to someone who loses it immediately after. You did your job; the next player failed theirs. xT football isolates your contribution.
What Is the Difference Between xT and xG?
Expected Goals (xG) measures shot quality – the probability a specific shot becomes a goal. Expected Threat (xT) measures possession value – the probability that possessing the ball in a specific zone leads to a goal.
The key distinction: xG only activates when a player shoots. xT activates every time the ball moves successfully.
| Metric | What It Measures | When It Registers |
|---|---|---|
| xG | Shot quality | Shot taken |
| xA | Pass quality before shot | Shot taken after pass |
| xT | Ball movement value | Any successful pass or carry |
This means a midfielder who plays a defence-splitting pass into the box earns xT value even if the receiver loses the ball. That same pass would register zero xA.
How Expected Threat Works: The xT Grid System Explained
To calculate Expected Threat, analysts divide the football pitch into a grid. Usually, this is a 16 × 12 grid, creating 192 unique zones.
Historic data from thousands of matches is fed into this grid. The model looks at every time a team had the ball in “Zone 55” (perhaps the center circle) and calculates how often a goal was scored within the next 5 to 10 actions.
The model accounts for two primary options a player has when they possess the ball in any given zone:
- Shoot: What is the probability of scoring directly from here?
- Move: What is the probability of moving the ball to a better zone?
The Positional Value Hierarchy
Naturally, the zones inside the penalty area have the highest xT value. Being there is inherently threatening. However, the highest xT generators are not the strikers standing in those zones, but the midfielders passing into them.
Think of it like a relay race.
The goalkeeper starts with the ball – threat is near zero. The center-back carries it forward and threat increases slightly. The regista spots a gap and plays a vertical pass through the lines – threat jumps significantly. The winger receives it, dribbles past a defender, and enters the box – threat peaks. The striker shoots. In this chain, the regista and the winger generated the highest Expected Threat because they moved the ball from low-value areas to high-value areas. The striker’s job was simply to convert that accumulated threat into xG and then a goal.
In this chain, the Regista and the Winger likely generated the highest Expected Threat because they moved the ball from low-value areas to high-value areas. The Striker’s job is simply to convert that threat into xG (and then a goal).
If we only looked at Assists, the Winger gets all the credit. If we look at Expected Threat, we see that the Regista’s line-breaking pass was just as crucial to the goal probability.
Which Players Have the Highest xT? Progressive Passers Ranked
This is where the eye test meets the data. We all know players who “run the game” but rarely show up on the scoresheet. These are your “Pre-Assist” Kings.

In the modern game, managers like Pep Guardiola and Mikel Arteta are obsessed with Expected Threat, even if they call it by different names (like “Control” or “Entry Passes”). They want players who can consistently feed the ball into high-value zones.
Let’s look at the data profiles of two distinct types of players to understand why xT is vital for recruitment and analysis.
Case Study: The Creator vs. The Finisher
Consider two hypothetical players: Player A (The Ball Progressor) and Player B (The Final Action Specialist).
| Metric | Player A (e.g., Kroos/Rodri) | Player B (e.g., Son/Sterling) |
| Goals | 2 | 15 |
| Assists | 5 | 10 |
| Expected Goals (xG) | 1.5 | 14.2 |
| Expected Assists (xA) | 4.0 | 9.5 |
| Expected Threat (xT) | 8.5 | 3.2 |
| Pass Completion % | 92% | 78% |
Analysis of the Data:
If you look at the basic stats, Player B is the superstar. They have 25 goal contributions (G+A). Player A only has 7.
However, Player A’s xT of 8.5 is monstrous. This indicates that Player A is responsible for moving the ball into the dangerous situations that allow Player B to get those assists and goals. Without Player A, Player B never receives the ball in space.
Real-world examples of High-xT monsters include:
- Trent Alexander-Arnold: His passing range allows him to move the ball from a low-value right-back zone to a high-value penalty box zone in a single action. He is an xT(Expected Threat) cheat code.
- Martin Ødegaard: He operates in the half-spaces, constantly threading balls through the eye of a needle. He accumulates massive xT by turning safe possession into dangerous attacks.
- Bernardo Silva: His ability to receive in tight spaces, carry through pressure, and progress the ball into dangerous zones makes him one of the highest xT generators in European football – despite rarely appearing on the scoresheet.
This xT metric football protects players like Sergio Busquets or Thiago Alcântara from unfair criticism. They aren’t there to assist; they are there to generate threat.
xT vs xG vs xA: Limitations of Expected Threat Analysis

No model is perfect, and as “Ultra-Human” experts, we must acknowledge the blind spots. Expected Threat is a location-based model, which leads to specific flaws you must be aware of.
1. The “Open Man” Fallacy
xT assumes that passing to “Zone 14” is always good. But what if Zone 14 is crowded by five defenders? The model sees the coordinate, not the pressure. A pass into a congested area might have high theoretical xT but low practical value because the receiver will instantly be tackled. Advanced ‘xT via Pass’ models from providers like StatsBomb are trying to fix this by adding tracking data, but standard xT football often misses defensive pressure.
2. The Dribbling Loophole
A player can sometimes “farm” xT by dribbling back and forth across a zone line. While algorithms filter this out, dribblers who carry the ball 50 yards without bypassing a defender can sometimes accrue high xT simply by getting closer to the goal, even if they haven’t actually destabilized the defense structure.
3. It Ignores the Receiver
xT (Expected Threat) gives full credit to the passer. It assumes the “average” player receives the ball. But passing to Erling Haaland in the box is worth more than passing to a defensive midfielder in the same spot. xT football doesn’t care who receives it, only where they receive it.
Despite these nuances, expected threat football analysis remains the single best metric for evaluating playmaking performance outside of the final shot.
Where This Leaves Us
Football is a game of territory and probability. For too long, we have viewed the sport through the narrow lens of the final touch – the shot, the goal, the assist. But the game is won in the transition from safety to danger.
Expected Threat (xT football) is the vindication of the deep-lying playmaker and the progressive carrier. It proves mathematically what great coaches have known intuitively: the player who breaks the defensive line is often more valuable than the player who squares the ball for a tap-in.
When you watch your next match, stop following the ball and start watching the space. Watch who moves the team forward. Watch who turns a 1% situation into a 15% situation. That player might not make the headlines, but they are the engine of the team. They are the masters of Expected Threat.
And now, you know exactly how to spot them.
What do you think?
Which current Premier League player do you think is most undervalued by assist charts alone – and is there a player whose xT numbers would shock most fans if they actually saw them?
Related Tactical Breakdowns
xT only tells you where the danger was built – these breakdowns show the tactical systems and metrics that determine how elite teams create and measure attacking threat from first touch to final shot.
What Is xG? Expected Goals Explained
Why it connects: xG measures the quality of the shot that xT helps create – understanding both metrics together reveals the full picture of how attacks are built and finished.

Zone 14: The Most Dangerous Space on the Pitch
Why it connects: Zone 14 is the highest-xT zone on the pitch – the area where ball progression translates most directly into goal probability.
Why it connects: PPDA measures how often a team presses; xT measures what that pressing prevents – the two metrics map opposite sides of the possession chain.
Don’t just watch football. Understand it.
Join KharaSportsDaily for occasional deep tactical insights most fans miss.
Frequently Asked Questions (FAQs)
How is xT different from Expected Assists (xA)?
Expected Assists (xA) measures the likelihood of a pass becoming a goal assist, meaning it requires the receiver to take a shot. If you make a brilliant pass but the receiver decides to dribble and loses the ball, you get 0.00 xA. Expected Threat (xT) rewards you for the pass itself because you moved the ball to a dangerous area, regardless of what the receiver does next.
Can a player have high xT but no assists?
Yes, absolutely. This is common for “the player who passes to the assister” (often called the secondary assist or hockey assist). Deep-lying playmakers like Granit Xhaka or Toni Kroos often have high xT scores but lower assist numbers because they operate earlier in the attacking chain.
Where can I find xT stats for players?
Can xT be used to compare players across different teams?
Yes, but with context. xT is influenced by team structure – a player in a possession-dominant system will accumulate more xT opportunities than one in a counter-attacking side. Compare players within similar tactical contexts for the most meaningful analysis, or use per-90-minute figures to normalise for playing time differences.