

Last updated: June 11, 2026
Bruno Fernandes finished the 2022-23 Premier League season with eight actual assists. His xA total for the same campaign? 16.7 – more than double his recorded return. Manchester United’s attacking players weren’t converting the chances he was creating, yet every traditional measure – assists, key passes – left analysts none the wiser about where the problem truly sat.
That 8.7-assist gap between Fernandes’ underlying output and his headline number isn’t an anomaly. It’s precisely the problem that expected assists (xA) was designed to solve. Key passes tell you a pass led to a shot. xA tells you whether it was worth anything.
In simple terms: Expected assists (xA) measures the probability that a given pass will become a goal assist, based on the quality of the chance created – not just whether a shot followed it.
Understanding the difference between these two metrics is one of the sharper edges in football analytics creativity. This article unpacks what xA captures that key passes miss, where it still falls short, and why it remains one of the most useful tools in modern squad evaluation.
Key Takeaways
- The Volume Trap: Key passes count every pass leading to a shot equally – a hopeful ball from 30 yards gets the same credit as a cutback to the six-yard box. Expected assists xA weights by chance quality, not just shot occurrence.
- The Fernandes Pattern: Bruno Fernandes posted 16.7 xA against 8 actual assists in 2022-23 per The Analyst, a gap that exposed Manchester United’s finishing deficiencies, not his creativity.
- De Bruyne’s Sustained Floor: Kevin De Bruyne, now at Napoli, posted xA-per-90 figures in the 0.35-0.55 band across his Manchester City peak per FBref – elite output that held regardless of teammate finishing.
- Provider Methodology Matters: Opta and FBref calculate xA only when a shot follows the pass; StatsBomb credits dangerous passes without requiring a shot. The same player can show different xA values depending on the provider.
- Sample Size Is the Enemy: xA stabilises only over roughly 20 or more matches. Single-match xA is statistically noisy and should never be the basis for a recruitment decision.
Table of Contents
What Is Expected Assists (xA)?
Think about the pass before the goal. Not the shot – the delivery that made the shot possible. That is the moment xA is trying to quantify.
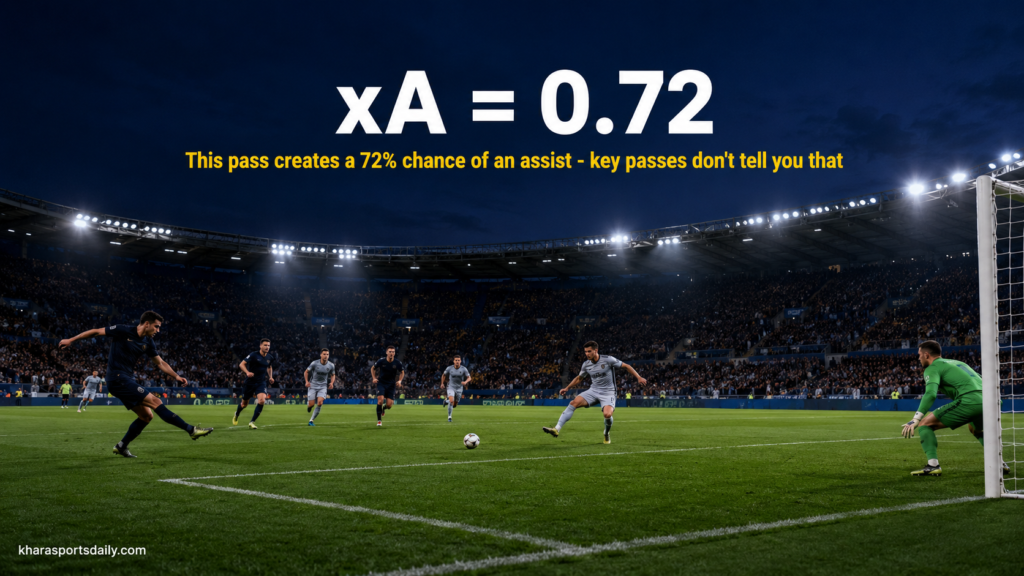
Every time a player plays a pass that leads to a shot, that pass is assigned an xA value between 0 and 1. A 0 means the pass is virtually never going to become a goal assist. A 0.7 means – based on the location, type, and context of the pass – that delivery produces an assist roughly seven times out of ten, historically. The sum of these values across a match or season gives you a player’s total xA.
The evolution from key passes matters here. A key pass simply flags that a shot followed. It treats a speculative effort from 25 yards and a one-on-one in the box as equal creative events. xA doesn’t. If De Bruyne threads a through ball that puts a striker one-on-one with a goalkeeper, that pass carries an xA of perhaps 0.45. If a midfielder pings a hopeful long ball that leads to a striker scuffing a shot from distance, that pass might carry an xA of 0.04. Both are key passes football. Only one reflects genuine creative danger.
Where providers diverge is instructive. Opta (and by extension FBref) calculates xA only from passes that directly precede a shot – it is shot-centric. StatsBomb’s model applies probability to all completed passes in dangerous areas, whether a shot follows or not. That pass-centric approach tends to reward players who consistently play into the right zones, even when teammates don’t pull the trigger. Neither model is wrong – but comparing xA figures across providers without knowing their methodology is a genuine analytical error.
What Is xA in football? Expected assists (xA) – is a probability metric that estimates how likely a given pass is to become an assist, based on historical conversion rates for similar chances. It is measured between 0 and 1, and the closer to 1, the more dangerous the pass was.
How xA Is Actually Calculated (And Why Providers Disagree)
Expected assists xA is calculated by assigning a probability value to each pass that creates a chance, based on historical conversion data. The model looks at where the pass started, where it ended, the type of delivery (ground pass, cross, through ball, cutback), the angle of the receiver’s run, and the defensive pressure around the receiving zone. Those variables are matched against millions of historical passes with similar characteristics, and the resulting probability – between 0 and 1 – is the xA value of that pass.
What complicates the picture is that no two providers calculate xA the same way. Opta’s xA model (which feeds FBref) is shot-centric: it only assigns xA to passes that are directly followed by a shot. StatsBomb’s model is pass-centric: it credits dangerous passes whether or not the receiver actually takes a shot. Soccerment goes further, applying a logistic regression trained on positional and contextual data that explicitly penalises long-ball passes where the receiver’s solo dribbling did the real work.
The practical implication for any reader of expected assists xA data is unambiguous: always check the provider methodology before comparing two figures. A 12.4 xA at FBref and a 9.8 xA at StatsBomb for the same player across the same season are not contradictions; they are two different models answering two slightly different questions.
Why Key Passes Have Always Been the Wrong Metric
Key passes count every pass that directly leads to a shot. That sounds useful until you sit with what it actually rewards. A 30-yard hopeful ball that loops to a striker who scuffs an effort off the side netting registers identically to a perfectly weighted through ball that puts a striker one-on-one with the goalkeeper. Both count as one key pass. The metric tells you a shot followed. It tells you nothing about whether the shot ever had a chance of becoming a goal.
This is the gap that expected assists xA was built to close. Where a key pass is binary (a shot happened, or it did not), xA is continuous (the shot had a 7% chance of scoring, or a 64% chance, or anything in between). That continuous scale is what makes xA stable across seasons in a way key passes never were. A high key pass total can be a function of a player taking on volume in a chaotic system. A high xA total over a meaningful sample of matches is much harder to fluke.
The other issue with key passes: they reward the wrong types of player. Set-piece specialists, deep crossers, and speculative long-range distributors accumulate key passes through volume. Per Opta, the players who consistently top xA leaderboards instead reward final-third precision and decision-making in the most dangerous zones of the pitch. The two metrics often tell different stories about the same player – and when they disagree, xA is the one to listen to.
How Kevin De Bruyne’s xA Redefined Playmaker Evaluation
Kevin De Bruyne is the clearest historical proof of what expected assists xA is built to measure: sustained creative output that survives every variable around it. Now at Napoli after a decade at Manchester City, De Bruyne built the strongest statistical case of any playmaker of his generation precisely because his xA numbers held up regardless of context – injury disruptions, variable teammates, rotating front lines never eroded the underlying creativity because he kept producing the passes.
During the 2019-20 Premier League season – when he equalled the all-time assist record with 20 – De Bruyne’s xA was comfortably aligned with his output. But the more revealing seasons were the ones where teammates underconverted. In 2020-21, his xA per 90 via FBref remained in elite territory despite fewer headline assists, which told analysts that the creative engine hadn’t dropped – only the finishing around it had.
The comparison with Bruno Fernandes clarifies the metric’s utility. Fernandes, consistently one of the Premier League’s highest xA generators, posted 16.7 xA in 2022-23 against 8 actual assists. That divergence wasn’t a failure of his creativity – it was a record of United’s attacking clinical issues. xA separated the creator’s contribution from the finisher’s.

The table below combines public season totals from FBref, The Analyst (Opta), and StatsUltra. It illustrates how xA and actual assists can diverge dramatically:
| Player | Season | Actual Assists | xA Total | xA Gap | Analytical Implication |
|---|---|---|---|---|---|
| Kevin De Bruyne | 2019-20 PL | 20 | ~18.5 | +1.5 | Performance in line with xA; teammates clinical |
| Bruno Fernandes | 2022-23 PL | 8 | 16.7 | -8.7 | Consistent creator; United’s finishing severely underperforming |
| Mohamed Salah | 2024-25 PL | 18 | ~14.2 | +3.8 | Outperformed xA; benefited from world-class finishers |
| Bryan Mbeumo | 2024-25 PL | ~11 | ~13.4 | -2.4 | Underperformed xA; Brentford’s finishing let him down |
Data reflects available season totals from FBref/Opta and TheAnalyst. Individual provider variance applies. 2019-20 De Bruyne xA figure is approximate.
The Mbeumo case is particularly instructive for recruitment. A scout watching raw assist numbers in 2024-25 might downrate him relative to Salah. xA told a different story: his pass quality was elite, but he was operating with inferior finishers around him. That distinction is the entire point.
Clubs have already acted on this logic. Norwich City’s sporting director Stuart Webber has publicly referenced using xA to identify Emiliano Buendía when his assist numbers in Spain’s second division were modest – but his underlying pass quality was not.
Bruno Fernandes did not become a better creator in 2025-26. The squad around him became better at finishing what he was already doing. That is what expected assists xA is built to surface – and what key passes will never tell you.
Where xA Falls Short – and How Analysts Exploit That {#xa-weaknesses}
Expected assists xA has four documented weaknesses that every serious analyst accounts for: model dependency, possession-volume inflation, sample-size instability, and blindness to the pass before the pass. The metric is useful, but only when those limitations are respected.
The most persistent problem is what happens between the pass and the shot. Opta’s shot-centric model assigns the xG of the resulting shot to the passer. If Romelu Lukaku receives a routine pass in midfield, drives 40 yards through three defenders and scores, the original passer gets credited with an xA equivalent to the shot’s xG – even though 90% of the chance’s value was Lukaku’s own creation. The pass-centric models attempt to fix this, but they introduce their own assumptions about what constitutes a dangerous zone.
The second problem is possession context. High-possession teams – think Pep Guardiola’s Manchester City at their peak – generate xA through volume as much as quality. A possession-adjusted xA per 100 passes tells a more honest story than raw season totals, but that figure requires either a data subscription or manual calculation. Most public-facing analytics sites don’t surface it.

Third: sample size. Over a single match, a player’s xA can look absurdly high or non-existent based on two or three passes. The metric stabilises only across larger samples – roughly 20 or more appearances. A scout making a recruitment call on a six-game xA figure is taking on significant statistical noise.
Finally, xA is blind to the pass before the pass. The deep-lying midfielder who rotates the ball to unlock the half-space, enabling the key pass, accumulates zero xA credit for their contribution. Expected Threat (xT) is a better framework for that type of contribution – it values actions that move the ball into dangerous zones, not just the final delivery before a shot.
Coaches who understand these gaps use xA as one layer of a wider picture – alongside key passes, shot-creating actions, xT, and actual video review. The teams that get into trouble are those that treat xA as a verdict rather than a signal.
The Bigger Picture
Key passes were never the problem. They were just the answer to a question nobody had fully asked yet. The question was: how good was the pass itself? Expected assists xA answers that. What it cannot answer is everything around it – the run that preceded the delivery, the pressing structure that created the space, the finisher’s own contribution to the shot’s quality.
That is not an argument for abandoning xA. It is an argument for using it the way the best analysts actually do: as a signal to investigate, not a score to trust blindly. Per FBref, De Bruyne’s career figures hold up across providers, seasons, and teammates because the underlying pass quality was consistent. That is what elite looks like in the data. Most players do not offer that kind of clarity.
The metric has earned its place. The question is whether the people using it have earned the right to use it alone.
How Recruitment Departments Actually Use xA
Inside professional clubs, expected assists xA is rarely consumed as a raw season total. Scouts and data analysts work with three derived figures: xA per 90 minutes (the rate-adjusted version), xA per 100 passes (the possession-adjusted version), and the assist-minus-xA differential over rolling 20-match windows. Each answers a different question.
xA per 90 tells you how dangerous a player is when they are on the pitch, removing the distortion of a starter who plays 3,200 minutes against a substitute who plays 800. xA per 100 passes corrects for team possession volume – a creator at a high-possession side like Manchester City accumulates raw xA simply by having more touches, which inflates totals without proving genuine quality. The 20-match differential is what surfaces undervalued players: a sustained negative gap (assists below xA) flags a creator whose teammates are letting him down, not a creator who is fading.

Norwich City’s sporting director Stuart Webber has publicly cited expected assists xA as central to the recruitment of Emiliano Buendia from the Spanish second division. Buendia’s headline assist numbers in Spain were modest. His underlying xA, per Stats Perform’s model, was elite for the level. The signal that the club acted on was not the outcome data – it was the process data. That is how xA works at the level it was actually designed for.
What Do You Think?
Bruno Fernandes posted 16.7 expected assists xA in 2022-23 and recorded only 8 actual assists per The Analyst. If recruitment departments are now treating that kind of gap as a primary signal of an undervalued creator, should clubs be using xA differentials as a hard trigger for striker investment decisions – or does that give one metric too much power over decisions that need full tactical context? Drop your take below.
Related Tactical Breakdowns

What Is xG? Expected Goals Explained
Why it connects: xA is built on the same probability logic as xG – understanding how expected goals calculates shot quality directly explains how xA assigns value to the pass that created the chance.
PPDA Explained: The Metric That Measures Pressing
Why it connects: Both xA and PPDA are process metrics – they measure the quality of an action rather than its outcome. Understanding one deepens your ability to read the other in tactical context.

Expected Threat (xT) Explained
Why it connects: xT credits the pass before the key pass – the action that moves the ball into dangerous zones. It fills the exact gap that xA leaves, making the two metrics natural companions in chance creation metrics analysis.
Don’t just watch football. Understand it.
Join KharaSportsDaily for occasional deep tactical insights most fans miss.
Frequently Asked Questions (FAQs)
What is the difference between xA and key passes in football?
A key pass simply records that a pass led to a shot – regardless of quality. Expected Assists (xA) weights that pass by the probability of the shot becoming a goal, based on its location, type, and context. A low-quality chance from 28 yards and a one-on-one in the box both count as key passes, but they carry very different xA values.
How is expected assists (xA) calculated?
xA is calculated by assigning a probability value to each pass that precedes a shot (or, in pass-centric models, each completed pass into a dangerous zone). That probability is based on historical data – how often similar passes, in similar locations, under similar conditions, resulted in a goal. The sum of these probabilities across a game or season gives total xA.
Which players consistently have the highest xA in the Premier League?
Kevin De Bruyne, during his Manchester City years (now at Napoli), produced some of the most sustained high- Expected Assists (xA) seasons in Premier League history. Bruno Fernandes and Bukayo Saka rank among the most consistent high-xA generators in recent seasons, though their actual assist totals can diverge significantly depending on the finishing quality around them.
Does a high xA always mean a player is a great creator?
Not necessarily in isolation. High possession teams generate more passing opportunities, inflating xA volume. A possession-adjusted xA per 100 passes, or per 90 minutes, offers a fairer comparison across different team contexts and playing styles.
Is xA more reliable than assists for evaluating playmakers?
Expected assists xA is more stable than raw assists over meaningful sample sizes, typically 20 matches or more. Assists depend on a teammate finishing the chance, which introduces variance that has nothing to do with the passer. xA isolates the passer’s contribution, which is why recruitment analysts treat it as a primary signal for evaluating creative players, with raw assists used as a secondary outcome check.