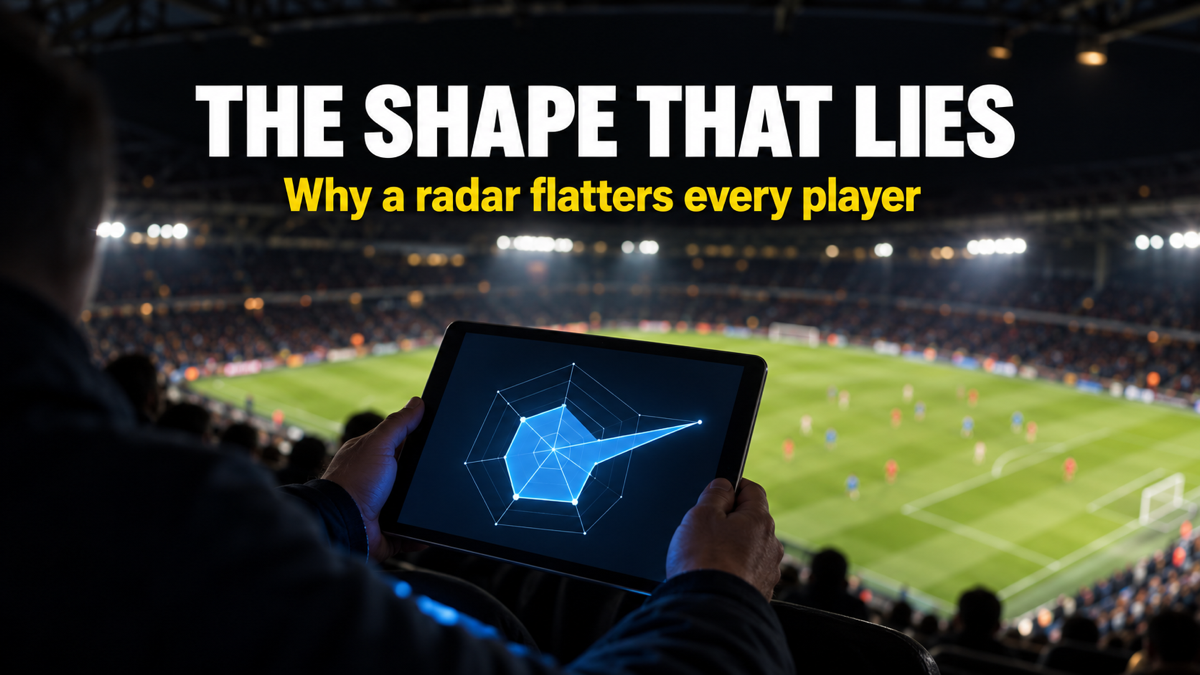

Open a data platform on a rotation full-back and the shape can look almost identical to a starting international. Both polygons fill most of the frame. Both look elite at a glance. That illusion is the first thing a football radar chart teaches you, and the reason so many fans misread one.
A football radar chart is a compression tool. It squeezes fifteen or twenty numbers into a single shape, and that shape is only as honest as the reader is careful. Treat it as a picture and it flatters almost everyone. Treat it as a coded table and it becomes the fastest player profile analysis in the game.
In simple terms: A football radar chart ranks one player against peers in their position, drawing each metric as a spoke whose length shows how high they rank.
This guide sits inside our wider football tactics framework, and it walks through every layer the picture hides: the boundary, the percentile, the per 90 base, and the shape itself.
Key Takeaways
- The boundary is a population, not the player: On a StatsBomb radar chart, the outer edge marks the top 5% and the inner edge the bottom 5% of players in that position, per StatsBomb.
- Percentiles beat raw totals: Percentile rankings tell you a winger sits above 88% of wingers for crosses, which is far more useful than a raw cross count.
- Everything is per 90: Per 90 stats put a 600-minute squad player and a 3,000-minute starter on the same scale, but they also hide how small a sample really is.
- Shape is a style fingerprint, not a grade: A spiky radar chart signals a specialist; a round one signals a generalist, and neither is automatically better.
- The comparison pool decides everything: Change the position template and the same scouting report metrics produce a completely different profile.
Table of Contents
What Is a Football Radar Chart?
A football radar chart is a circular graphic that plots one player’s statistical output across many metrics at once, with each metric drawn as a spoke from a shared centre. The longer the spoke, the better that player ranks in that metric against a chosen peer group. Analysts also call it a spider chart, because a finished profile looks like a web.
The centre is zero and the rim is the ceiling. On a StatsBomb radar chart, that rim is not the single best player; it is the top 5% of everyone in that position across recent seasons of the big five European leagues, per StatsBomb. The inner ring is the bottom 5%, and everything you see is squeezed between those two walls.
Think of it as a heat map for one footballer. Instead of reading twenty rows in a spreadsheet, you read one shape, which is the entire promise of a radar chart. The trade-off is that compression always hides detail.
The catch is that the shape means nothing without its labels. A huge spoke is only impressive once you know what it measures and who it is measured against.
How to Read the Spokes and the 5% Boundary
Read a radar chart spoke by spoke, never as a whole shape. Each spoke is one metric, and its length is the only thing that carries meaning. The polygon connecting the spokes is just tissue your eye invents.
Start at the rim. Because the outer edge is the top 5% and the inner edge the bottom 5%, a spoke that nearly touches the rim is genuinely rare output, not merely good, per StatsBomb’s radar documentation. StatsBomb also colours the printed numbers, with elite values in green and weak ones in red, so the radar chart and the figures agree.
Not every spoke measures the same kind of thing. A value spoke such as On-Ball Value (OBV) only stretches toward the rim for genuine progressors, while a raw-volume spoke like passes can look long for a player who simply recycles possession sideways.
Then check direction. Some providers invert “negative” metrics like turnovers and times dribbled past, so that further from the centre always reads as better. The Analyst notes that Opta radars flip these reversed metrics deliberately, which keeps the reading honest at a glance.
A spoke near the rim on a possession metric and a spoke near the centre on a defensive one is not a contradiction. It is a role. Reading the radar chart well means treating those spokes as a job description, not a scorecard.
Percentiles: The Numbers Behind the Shape
A percentile tells you what share of comparable players a footballer beats in one metric. An 88th percentile for shot-creating actions means the player ranks above 88% of peers in that position, not that he produced 88 of anything. Percentile rankings are the grammar of every modern radar chart.
This is why percentiles travel better than totals. Ten goals means little until you know the position, the minutes, and the league, but a 91st percentile already carries that context. FBref builds its percentile-based scouting reports against a position-specific comparison pool, which is what makes one number portable.
The scale itself is compressed on purpose. The Analyst explains that Opta player radars draw the outer ring at the 95th percentile and the inner ring at the 5th, with a linear scale between, so a handful of freak outliers cannot stretch the whole shape out of proportion.
That compression is a feature and a warning. It means the gap between the 70th and 95th percentile can look small on the radar even though, in elite terms, it is enormous.
Per 90, Possession, and the Sample-Size Trap
Every number on a radar chart is a rate, not a total, almost always expressed per 90 minutes. Per 90 stats divide a player’s output by minutes played, then scale to a full match, so a substitute and an ever-present sit on the same axis. Without that step, minutes alone would decide the shape.
StatsBomb goes one step further on defending. Many of its defensive spokes are possession-adjusted, because a player on a team that sees little of the ball gets more chances to tackle and intercept, per StatsBomb. Possession adjustment strips out that false volume.
The real trap is sample size. Per 90 stats from 300 minutes can look spectacular and mean almost nothing, which is why Opta only includes seasons of at least 1,350 minutes in its radar pool, per The Analyst. A radar chart built on half a season is a rumour, not a verdict.
The table below shows how the same raw tally reads differently once you convert it into per 90 stats and a percentile.
| Metric | Raw season total | Per 90 stat | Percentile vs position |
|---|---|---|---|
| Progressive passes | 180 | 6.4 | 84th |
| Shot-creating actions | 96 | 3.4 | 78th |
| Tackles won | 38 | 1.4 | 41st |
| Pressures | 410 | 14.6 | 63rd |
Data reflects illustrative benchmark metrics across a single top-five-league midfield season. Individual team and season variance applies.
Read across one row and the story changes shape. A modest 38 tackles becomes a below-median 41st percentile once it is a per 90 stat measured against other midfielders.
Shape Reading: Specialists, Generalists, and Role Fit
The overall shape of a radar chart is a style fingerprint, not a quality score. A spiky radar chart, long in two or three directions and short everywhere else, marks a specialist. A round, evenly filled radar chart marks a generalist who does many things at a good level.
Neither shape wins automatically. A penalty-box striker should look spiky, with long shooting and touches-in-box spokes and almost nothing for progressive carries. A deep playmaker should look rounder, and judging the striker by the playmaker’s template is the most common error in player profile analysis.
This is where scouting report metrics earn their keep. Two forwards with the same goal tally can carry opposite radar charts, one built on volume shooting and one on link play, and a club hunting a specific role wants the matching shape. The radar chart sorts candidates before a single minute of video is watched.
Value-based spokes sharpen that read again. A long Expected Threat (xT) spoke flags a player who pushes the ball into dangerous zones, which separates a genuine creator from a busy passer who never actually threatens a defence.
Used this way, a radar chart is a filter, not a verdict. It narrows a shortlist of fifty names to five worth real scouting time, which is exactly what StatsBomb and Opta built the tool to do.
The Weakness: Where Radar Charts Mislead You
The biggest weakness of a radar chart is that your eye reads the wrong thing. You judge the area of the filled polygon, but only the individual spoke lengths carry meaning, and area grows non-linearly. A profile that looks twice as “big” is not twice as good.
Worse, that area depends on the order of the metrics. Reorder the spokes and the polygon’s shape changes completely, even though not one number has moved, a flaw data-visualisation analysts have flagged for years. The shape you are emotionally reading is partly an accident of layout.
Then there is the stylistic-versus-quality problem. Many radar chart spokes, especially for defenders, describe how a player plays rather than how well, so a long spoke can simply mean high volume inside a system. StatsBomb now plots each metric’s full distribution beside the radar chart partly to fight this misreading.
Sample size is the final trap. An early-season or post-injury radar chart can crown a player on a few hundred minutes, then collapse by spring. This is why analysts treat the radar chart as a conversation starter that points toward video and live scouting, never as the last word on a player profile analysis.
The Tactical Takeaway
A football radar chart is the best fast-scan tool football analytics has produced, and the most abused. It rewards readers who treat it as a coded table and punishes those who treat it as a picture. The shape seduces; the spokes inform.
My position is simple. A radar chart should never close an argument, only open one, because the moment a profile looks elite, the right response is to ask which metrics, which position pool, and how many minutes built it. Every one of those can flatter a shape.
Read that way, the radar chart becomes a genuine edge. It turns twenty columns of scouting report metrics into a thirty-second judgement that beats instinct far more often than not, as long as you respect what the boundary, the percentile, and the per 90 base are really telling you.
What Do You Think?
If a squad player and a starter post near-identical football radar charts over a season, but the squad player did it in 700 minutes and the starter in 2,800, should a recruitment team trust the shape or bin it? One reading calls it upside; the other calls it noise. Tell me which way you lean and why.
Want to read any match like this?
The framework behind these breakdowns, in one place. The four phases, a 15-minute method for diagnosing both teams before the drinks break, a printable match-watching worksheet, and 51 terms defined. 40 pages.
Get the pack$9, instant downloadRelated Tactical Breakdowns
The Packing Football Metric: Why Pass Completion Stats Miss the Point Entirely
Why it connects: Packing is one of the value metrics a single radar spoke can represent, so it shows what the number behind the shape actually rewards.
Expected Assists (xA) vs Key Passes: 7 Truths That Reframe Football Creativity
Why it connects: Expected Assists is a headline creativity spoke on attacking profiles, and this explains why its percentile can flatter a pure crosser.
Post-Shot xG (PSxG) Explained: The Complete Guide to Measuring Goalkeeper Performance
Why it connects: Goalkeeper profiles run on a completely different template, and Post-Shot xG is the metric that anchors them.
Speak the language of the game
Get the free 47-term tactical glossary. Gegenpress, half-space, xT, low block, each defined in plain language and linked to a full breakdown. It is yours for an email.
Frequently Asked Questions
What is a football radar chart in simple terms?
A football radar chart ranks one player against positional peers across many metrics at once. Each metric is a spoke, and a longer spoke means a higher ranking. It compresses a full stat sheet into one readable shape for quick player profile analysis, which is why scouts use it as a first filter.
How do you read percentiles on a radar chart?
Read each percentile as the share of peers a player beats in that metric. An 80th percentile means the player ranks above 80% of players in his position, per FBref’s method. Percentile rankings, not raw totals, are what the spoke length on the radar chart represents, so always check the comparison pool.
Why do radar charts use per 90 stats?
Radar charts use per 90 stats so players with different minutes can be compared fairly. Dividing output by minutes and scaling to 90 puts a substitute and a starter on one axis. The drawback is that per 90 stats from small samples can look elite while meaning very little until the minutes pile up.
Are football radar charts reliable for scouting?
Football radar charts are reliable as a first filter, not as a final verdict. They quickly sort player profiles by style and rank, but they hide sample size and reward stylistic volume. Most analysts pair every profile with video and live scouting before any recruitment decision is signed off.