


Nottingham Forest spent the 2024-25 Premier League season moving the ball toward goal at 2.1 metres per second. Manchester City, the same season, crawled forward at 1.4, the slowest in the division, per The Analyst. One number reads as aggression and the other as control, and the gap between them is the whole argument about how football should be played.
Direct Speed is the metric that puts that argument on a scale. It measures tempo, not threat, which is exactly why it gets misread. A fast figure looks brave and a slow one looks composed, yet neither tells you whether the move created a real chance or just sterile possession.
In simple terms: Direct Speed is how many metres per second a team moves the ball toward goal during an attacking sequence.
This breakdown separates directness from efficiency, the two ideas the number is most often confused for.
Key Takeaways
- Tempo, not quality: The metric is Progress divided by sequence time, the metres-per-second a team moves toward goal, per Opta.
- Two different axes: Nottingham Forest’s 2.1 m/s did not make it more dangerous than Manchester City’s 1.4 m/s by default, per The Analyst.
- Fast and slow are both tools: Opta separates rapid direct attacks from patient build-up attacks, and elite teams use both on purpose.
- Conversion is where pace pays: Bournemouth turned 298 high turnovers into 62 shots (20.8%), beating Manchester City’s 13.7%, per The Analyst.
- Speed without control is waste: A rushed vertical pass that misses is a turnover, which is why the quickest team rarely tops the table.
Table of Contents
What Is Direct Speed?
Direct Speed is the average speed, in metres per second, at which a team moves the ball toward the opponent’s goal during an attacking sequence. Opta defines it as Progress divided by sequence time, where Progress is the distance the ball travels goalward and sequence time is how long that passage of play lasts.
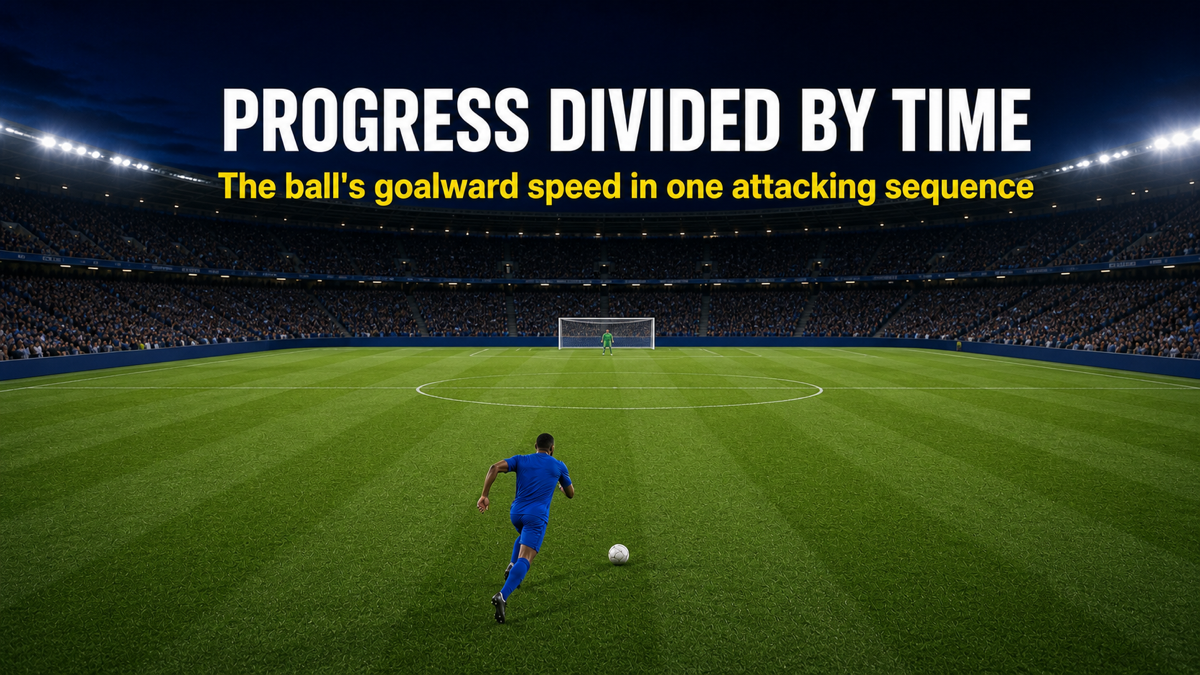
The cleanest way to picture it is a single counter-attack. A team wins the ball on the edge of its own box, strings four passes up the pitch, and works a shot eleven seconds later having covered fifty metres toward goal. That move ran at roughly 4.5 metres per second, fast by any standard.
Manchester City rarely post that kind of number. Their build-up moves sideways and backward as often as forward, so even a long possession registers low because Progress stays small while time climbs. The metric is not judging them harshly; it reports tempo, and tempo is a choice, not a virtue.
How Opta Measures Directness
Opta measures directness through its sequences framework, which strings consecutive on-ball events into one passage and then describes its shape. The two headline labels sit at opposite ends of the same scale, according to Opta’s published stat definitions.
A direct attack is an open-play sequence that starts just inside a team’s own half, moves at least 50% toward the opposition goal, and ends in a shot or a touch in the box. Build-up attacks are the slow cousin: ten or more passes that end the same way. The tempo number is the continuous figure underneath both labels, the actual velocity rather than the category.
Directness measured this way is not the same as penetration. Packing counts how many defenders a single pass takes out of the game, which a slow sequence can do as well as a fast one. The tempo number only knows how quickly the ball travelled, so a frantic sideways scramble and a line-breaking surge can read alike.
Directness Is Not Efficiency
Directness and efficiency are different axes, and this metric only measures one of them. Efficiency asks how much threat a team manufactures per unit of the ball, often expressed as expected goals per sequence or per possession. Tempo asks only how fast the ball went forward.
A team can be quick and wasteful or slow and lethal. Possession efficiency, the xG a side generates relative to how much it holds the ball, is the figure that actually tracks chance creation, while raw pace on its own does not. Faster is sometimes better and sometimes worse, because the value of a vertical pass depends on the space it attacks, not the speed it travels at.
This is the trap. A coach who chases tempo for its own sake can speed the team up without making it more dangerous, trading patient overloads for hopeful long balls that arrive faster and create less.
The Premier League’s Fast and Slow Extremes
The 2024-25 Premier League stretched Direct Speed from 2.1 metres per second down to 1.4. Nottingham Forest were the most direct team in the division, while Manchester City were the most patient, per The Analyst’s 2024-25 Premier League style breakdown.
The passing numbers underneath tell the same story from another angle. Manchester City averaged 5.1 passes per open-play sequence, the highest in the league, and Southampton 4.4, while the direct sides moved the ball forward in far fewer touches. Vertical ball progression, not pass volume, is what the metric rewards.
Neither extreme guaranteed results. Forest’s directness drove an overachieving season, while City’s patience still produced the most territory, which is the first hint that this number predicts style far better than it predicts success.
Turning Speed Into Shots: The Conversion Test
Pace only pays off if the fast attack ends in a shot, which is where conversion data separates the contenders from the long-ball merchants. The clearest test is high turnovers, possessions won within 40 metres of the opponent’s goal, and the share of them that become shots.
Here Bournemouth stand out. They turned 298 high turnovers into 62 shots in 2024-25, a 20.8% conversion rate, comfortably ahead of Manchester City’s 300 turnovers for 41 shots, or 13.7%, per The Analyst. Speed near the goal, paired with bodies in the box, is what made the difference.
| Team (2024-25) | Speed of Attack | High Turnovers to Shots | What It Reveals |
|---|---|---|---|
| Nottingham Forest | 2.1 m/s (most direct) | 21.3% conversion | Directness backed by ruthless finishing |
| Bournemouth | Among the most direct | 298 turnovers, 62 shots (20.8%) | Fewer turnovers than City, far more shots |
| Manchester City | 1.4 m/s (most patient) | 300 turnovers, 41 shots (13.7%) | High volume, lower payoff per turnover |
Data reflects average and total metrics across the 2024-25 Premier League season, per The Analyst. Individual team and season variance applies.

The pattern is not that fast beats slow. Teams at the top of this list combine quick vertical entry with numbers arriving in the box, so the pace buys a shot instead of a giveaway.
Direct Speed in Transition Moments
Direct Speed peaks in transition, the seconds after a turnover when the opponent is unstructured and the fastest route forward is also the safest. This is where a high reading genuinely correlates with danger, because the defence has not yet set and vertical space is open.
The window is short. Threat decays quickly once the defence recovers its shape, which is why elite counter-attacking teams treat the first seconds after a turnover as the moment to push tempo as high as it will go.
In settled possession the same urgency becomes a liability. Forcing a pass into a packed block trades a controlled attack for a low-percentage one, so the best teams raise and lower their Direct Speed by game state rather than running at one gear all match.
The Weakness: When Speed Becomes Waste
The weakness of the metric is that it cannot tell a brilliant fast attack from a reckless one, because a misplaced vertical pass and a line-breaking assist can post the same velocity. The number rewards the attempt, not the outcome, so a team that hits hopeful balls forward looks impressively direct right up to the moment it gives possession away.

This is how chasing the figure backfires. Speeding up a build-up that is not ready forces passes into traffic, and every turnover from a rushed vertical ball hands the opponent the exact transition that pace is supposed to win. The quickest route forward is only the best route when the space is actually there.
The fix is not always more speed. Sometimes it is a deliberate pause to reset a rushed attack, slowing the sequence into a build-up attack so the team arrives in numbers rather than in a hurry. Pep Guardiola wins precisely by refusing the fast option when the slow one keeps the ball, which is why Manchester City’s league-low Direct Speed is a design feature, not a flaw.
Teams that beat a direct side do it by staying compact and inviting the rushed pass, betting that speed without space will eventually cost the attacker the ball.
Final Thoughts
Direct Speed is one of the most honest tempo metrics in the public game, and one of the most misused. It tells you how a team plays with total clarity and almost nothing about how well, which is a feature once you stop expecting it to grade quality.
The teams that get the most from it treat pace as a tool they pick up and put down. Nottingham Forest weaponised directness because they had the finishing to back it; Manchester City won territory by refusing it, reading the metric next to xG and field tilt rather than chasing it. Both were right, because the question was never simply fast or slow.
The real measure of a side is whether its tempo matches its intent in the moment, quick when the space is open, patient when it is not. The scoreboard rewards the teams that decide on purpose.
What Do You Think?
Nottingham Forest attacked at 2.1 metres per second and overachieved, while Manchester City sat at 1.4 and dominated territory. So is a high Direct Speed the mark of a brave, well-drilled side, or just a team that cannot control games long enough to slow down? Make your case below.
Want to read any match like this?
The framework behind these breakdowns, in one place. The four phases, a 15-minute method for diagnosing both teams before the drinks break, a printable match-watching worksheet, and 51 terms defined. 40 pages.
Get the pack$9, instant downloadRelated Tactical Breakdowns
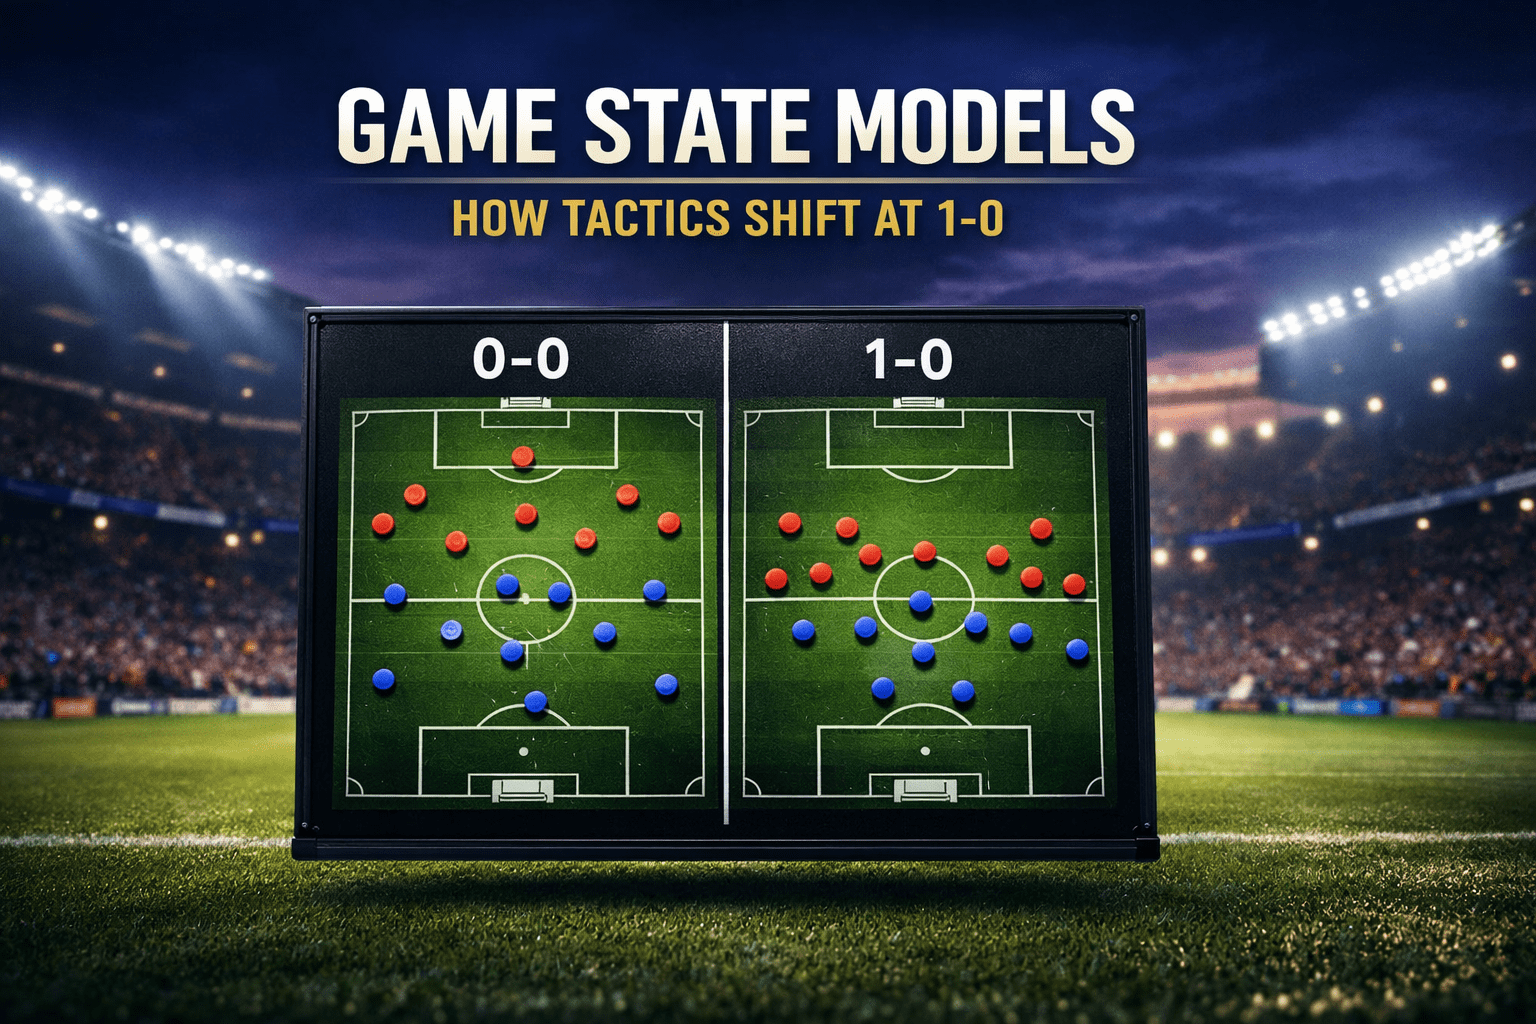
Game State Models Explained: How Elite Teams Shift Tactics the Moment They Score
Why it connects: Teams deliberately drop their tempo once they lead, which is exactly the tactical shift game state models measure.

Expected Threat (xT) in Football: The Complete Guide to Understanding This Metric
Why it connects: Expected Threat values where the ball moves while this metric values how fast it gets there, so the two together judge progression quality.

Relationism in Football: The Complete Tactical Guide (2026)
Why it connects: Relationism tends to produce slower cluster-based progression, the stylistic opposite of the directness positionist sides chase.
Speak the language of the game
Get the free 47-term tactical glossary. Gegenpress, half-space, xT, low block, each defined in plain language and linked to a full breakdown. It is yours for an email.
Frequently Asked Questions
What is Direct Speed in football?
Direct Speed is the average metres per second a team moves the ball toward goal during an attacking sequence. Opta calculates it as Progress, the distance gained goalward, divided by sequence time. The metric measures tempo, not the danger of the attack itself.
How are direct attacks different from build-up attacks?
Direct attacks are fast sequences while build-up attacks are slow ones. Opta logs a direct attack when a move starts inside a team’s own half, travels at least 50% toward goal, and ends in a shot or box touch. A build-up attack is ten or more passes ending the same way.
Which team had the highest Direct Speed in 2024-25?
Nottingham Forest had the highest reading in the 2024-25 Premier League at 2.1 metres per second, per The Analyst. Manchester City had the lowest at 1.4. The figure reflects playing identity, not final table position.
Does a higher number mean a team is better?
No, a higher figure does not mean a team is better, only faster. The metric tracks tempo, not efficiency, so a quick attack can still be wasteful. Bournemouth converted high turnovers into shots at 20.8% in 2024-25, while rushed long balls usually end in giveaways.