


David De Gea once saved 13 more goals than an average goalkeeper would have across a single Premier League season. That number comes from StatsBomb’s goalkeeper analysis, and a simple save percentage never came close to capturing it. A save percentage treats a tap-in and a top-corner rocket as the same event, so it flatters keepers who face easy shots and punishes those who face daggers. The expected goals framework fixed that imbalance for strikers first, then handed goalkeeping its own correction.
In simple terms: Goals Saved Above Average measures how many goals a keeper prevented compared to what an average keeper would have conceded facing the same shots.
This metric judges a goalkeeper on the difficulty of the chances faced, not the scoreline behind him. Here is how GSAA works, what the 2024-25 Premier League numbers expose, and where the stat quietly misleads.
Key Takeaways
- Quality over quantity: Goals Saved Above Average weights every shot by its difficulty, so stopping ten daggers counts for more than stopping fifty tame efforts.
- The league is the baseline: A keeper is measured against what an average keeper would concede facing identical shots, the logic behind StatsBomb and Opta’s goals prevented models.
- Ederson led 2024-25: Per FBref, Ederson finished the Premier League season at plus-5.0 post-shot expected goals minus goals allowed, ahead of Jordan Pickford at plus-4.8 and Alisson at plus-3.5.
- Volume distorts the table: Busy keepers on weaker teams can post huge totals simply by facing more shots, so context still matters.
- It is shot-stopping only: GSAA says nothing about distribution, sweeping, or claiming crosses.
Table of Contents
What Is Goals Saved Above Average (GSAA)?
Goals Saved Above Average is a shot-stopping metric that counts how many goals a goalkeeper prevented relative to a league-average keeper facing the same shots. It starts from the difficulty of every shot on target, then compares the goals an average keeper would have conceded with the goals this keeper actually conceded. A positive number means the keeper beat the baseline, and a negative number means he fell short of it.

The metric exists because raw save percentage rewards the wrong thing. A keeper who faces twenty long-range efforts can post a glittering save percentage without ever making a genuinely hard save. GSAA strips that luck out by asking a sharper question: given these exact shots, how many would a typical keeper have stopped?
Think of it as a handicap system for goalkeeping. StatsBomb built its goalkeeper module around this idea, and American Soccer Analysis popularised the GSAA label across the analytics community. The result is a single number that travels across teams and seasons, which is exactly why recruitment departments lean on it.
How GSAA Is Calculated: A Baseline, Not a Save Count
GSAA is calculated by subtracting a goalkeeper’s actual goals conceded from the goals an average keeper would have conceded facing the same shots. The expected figure comes from weighting each shot on target by its difficulty, a process modern data calls post-shot expected goals. Post-shot expected goals reads the placement, pace, and angle of a strike after it leaves the boot, so a shot drilled into the top corner carries a far higher value than one rolled at the keeper.
A worked example makes it concrete. Imagine a keeper faces a season of shots that an average goalkeeper would concede 38 times. If he actually concedes 25, his GSAA is plus-13, the same margin StatsBomb credited to David De Gea in his strongest shot-stopping season.
FBref publishes the identical concept under the label post-shot expected goals minus goals allowed, often shortened to PSxG plus-minus. The math is the same, and only the branding differs between data providers.
What the 2024-25 Premier League Numbers Reveal
The 2024-25 Premier League season showed elite shot-stopping clustered at the top of the table, though not always where reputations expected. Per FBref’s advanced goalkeeping data, Ederson finished the campaign at plus-5.0 post-shot expected goals minus goals allowed, the best mark in the division despite a busy season behind a thinner Manchester City midfield. Jordan Pickford followed at plus-4.8 and Alisson at plus-3.5, per the same data.
The table below ranks the season’s most revealing shot-stopping returns.
| Goalkeeper (2024-25) | Post-Shot xG Minus Goals Allowed | Shot-Stopping Read |
|---|---|---|
| Ederson (Manchester City) | +5.0 | Saved around five goals more than an average keeper facing the same shots |
| Jordan Pickford (Everton) | +4.8 | Elite season for a mid-table side that conceded plenty of chances |
| Alisson (Liverpool) | +3.5 | Steady over-performance behind a strong defence |
| Bart Verbruggen (Brighton) | -5.0 | Conceded roughly five more than the post-shot model expected |
Data reflects 2024-25 Premier League post-shot expected goals figures per FBref. Individual team and season variance applies.
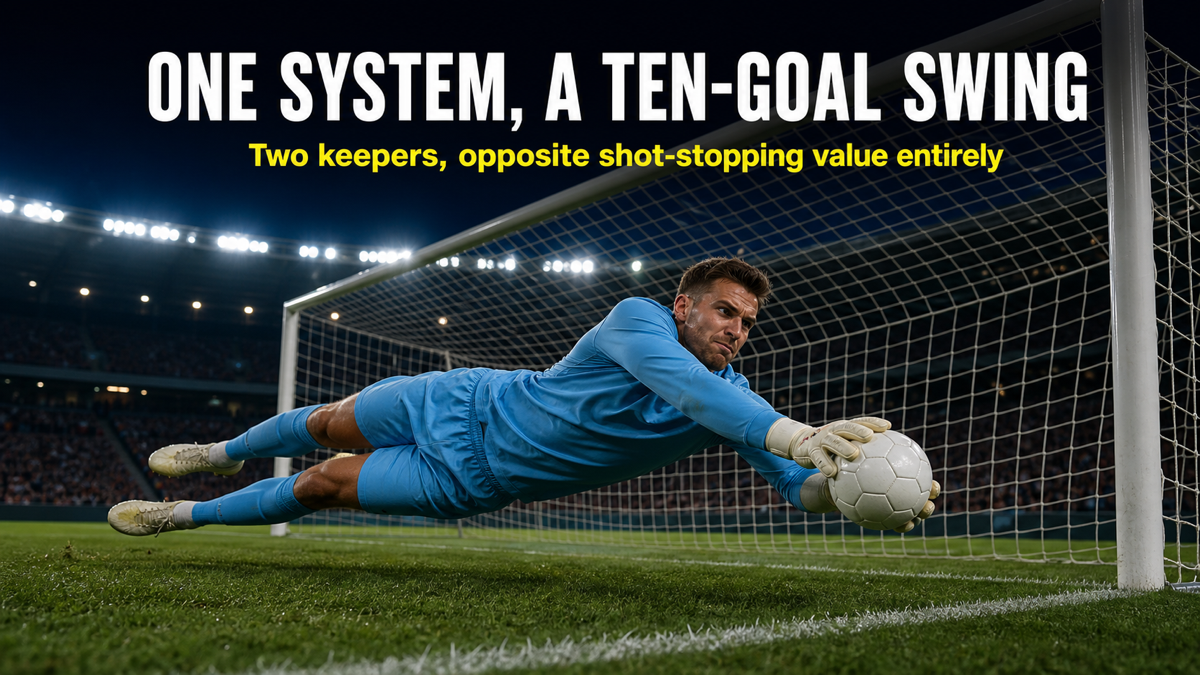
The spread tells a story raw tables hide. Ederson and Bart Verbruggen both played behind possession-heavy sides, yet one keeper added five goals of value and the other erased five. That ten-goal swing between two keepers in broadly similar systems is precisely the gap this metric was built to surface.
Why Volume Quietly Inflates the Table
Shot volume is the biggest confounder in any Goals Saved Above Average ranking. A keeper who faces 150 shots on target has far more chances to bank value than one who faces 70 behind a dominant team. A busy keeper on a relegation side can therefore out-score a serene keeper at a title contender, even when the second keeper is the better shot-stopper on a per-shot basis.
Rate metrics solve half of this problem. Goals prevented per shot faced, or per 90 minutes, strips out the volume effect and reveals efficiency rather than raw accumulation. Opta’s goals prevented model and FBref both let analysts toggle between the totals and the rates for exactly this reason.
The lesson is to read the counting stat and the rate together. A high total with a weak rate signals a keeper propped up by workload, while a strong rate on low volume signals quality waiting for a bigger stage.
GSAA vs Save Percentage and Clean Sheets
GSAA corrects the two numbers fans still quote most: save percentage and clean sheets. Save percentage ignores shot difficulty, so a keeper facing soft chances looks elite while doing very little. Clean sheets reward the whole defence and the fixture list, not the keeper’s hands.
Consider two keepers who share an identical 75% save percentage. If one faced a procession of close-range chances and the other faced long shots, their shot-stopping was not remotely equal, yet the percentage hides it completely. The metric separates them instantly, because it knows what every shot was actually worth.
This is why analysts now treat save percentage as a starting point rather than a verdict. It tells you the outcome, but never the difficulty of the work behind that outcome.
The Weakness: What GSAA Cannot Measure
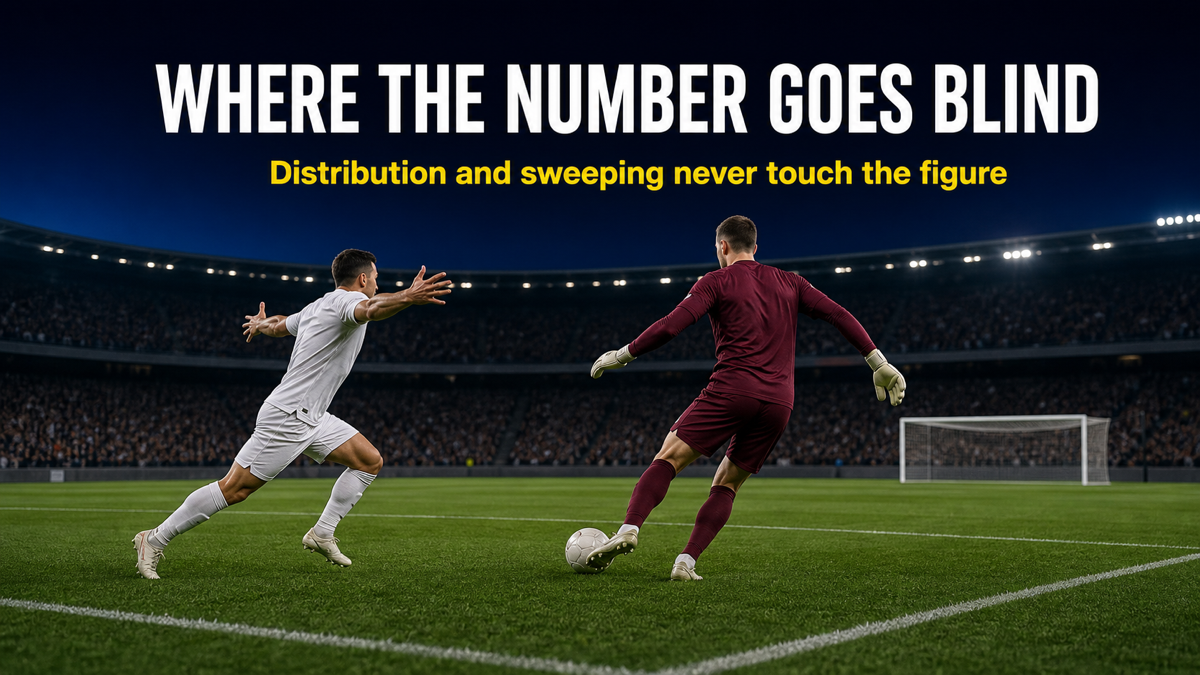
GSAA captures shot-stopping and nothing else, which makes it a dangerous stat to use on its own. A modern goalkeeper is judged on distribution, on sweeping behind a high line, and on claiming crosses, none of which appear anywhere in the number. A keeper can post a glowing shot-stopping figure while quietly gifting goals through poor passing under pressure.
The metric also leans entirely on the quality of the underlying model. Post-shot expected goals cannot see a defender’s deflection, a slip, or a screened sightline, so noise enters every single figure. Small samples make this worse, which is why a brilliant ten-game run can evaporate over a full season.
This is where the goalkeeper distribution profile matters as much as the save count. Manchester City signed Gianluigi Donnarumma in 2025 for his shot-stopping pedigree, then asked him to match Ederson’s footwork, a demand no shot-stopping metric could ever have predicted. Judging that transfer on goalkeeper shot-stopping metrics alone would miss the entire reason it was a gamble.
The Final Word
Goals Saved Above Average is the closest football has to an honest shot-stopping scorecard, and it earns its place in every serious recruitment file. It does what save percentage and clean sheets never could, by pricing the difficulty of the work rather than the outcome that followed. The danger is treating it as a verdict on a goalkeeper rather than a verdict on one of his jobs.
Read it next to volume, next to the distribution numbers, and next to your own eyes. A keeper is not the sum of his saves, but the saves are finally measured properly, and that alone is worth a great deal.
What Do You Think?
Ederson posted the best shot-stopping figure in the Premier League in 2024-25, yet Manchester City still replaced him with Gianluigi Donnarumma for his feet. If the shot-stopping numbers said Ederson was elite, was selling him a tactical upgrade or an expensive mistake? Make your case below.
Want to read any match like this?
The framework behind these breakdowns, in one place. The four phases, a 15-minute method for diagnosing both teams before the drinks break, a printable match-watching worksheet, and 51 terms defined. 40 pages.
Get the pack$9, instant downloadRelated Tactical Breakdowns

What Is a Sweeper-Keeper? The Complete Guide to Modern Goalkeeper Tactics
Why it connects: Shot-stopping is only one of a keeper’s jobs, and the sweeper-keeper role covers the sweeping and high-line defending this metric never sees.

On-Ball Value (OBV): The Metric Rewriting How Football Judges Midfielders
Why it connects: On-Ball Value uses the same idea, crediting actions for the value they add above a baseline, then applies it to outfield players.
The Packing Football Metric: Why Pass Completion Stats Miss the Point Entirely
Why it connects: Like this metric exposing what save percentage hides, Packing reveals the progress that pass-completion stats quietly bury.
Speak the language of the game
Get the free 47-term tactical glossary. Gegenpress, half-space, xT, low block, each defined in plain language and linked to a full breakdown. It is yours for an email.
Frequently Asked Questions
What is a good GSAA score for a goalkeeper?
A good GSAA score is any positive figure sustained across a full season, with elite keepers reaching plus-4 or higher. Per FBref, Ederson topped the 2024-25 Premier League at plus-5.0, while most starters land between minus-3 and plus-3. One strong season can be noise, so analysts trust multi-year positives most.
How is GSAA different from save percentage?
GSAA differs from save percentage by weighting every shot by its difficulty rather than treating all shots as equal. A keeper facing soft efforts posts a high save percentage without real shot-stopping, while GSAA measures him against the quality of chances actually faced. That makes the figure far harder to inflate.
Does GSAA measure a goalkeeper’s full performance?
No, GSAA measures shot-stopping alone and ignores the rest of modern goalkeeping. Distribution, sweeping behind a high line, and claiming crosses never enter the figure, so a keeper can rate well while costing goals elsewhere. Pair it with a wider goalkeeper shot-stopping metrics suite and distribution data for a complete read.
Which goalkeepers ranked best for goals prevented in 2024-25?
Ederson, Jordan Pickford, and Alisson ranked among the best for goals prevented in the 2024-25 Premier League. Per FBref, Ederson led at plus-5.0, Pickford followed at plus-4.8, and Alisson posted plus-3.5. Bart Verbruggen sat at the other end of the table near minus-5.0.